- Shubham Vishwakarma
 Shubham Vishwakarma
- Mar 02, 2026 11:40 UTC
-
Solana Price Faces Pressure as Global Tensions Rise: Sell Signal Adds to Market Anxiety
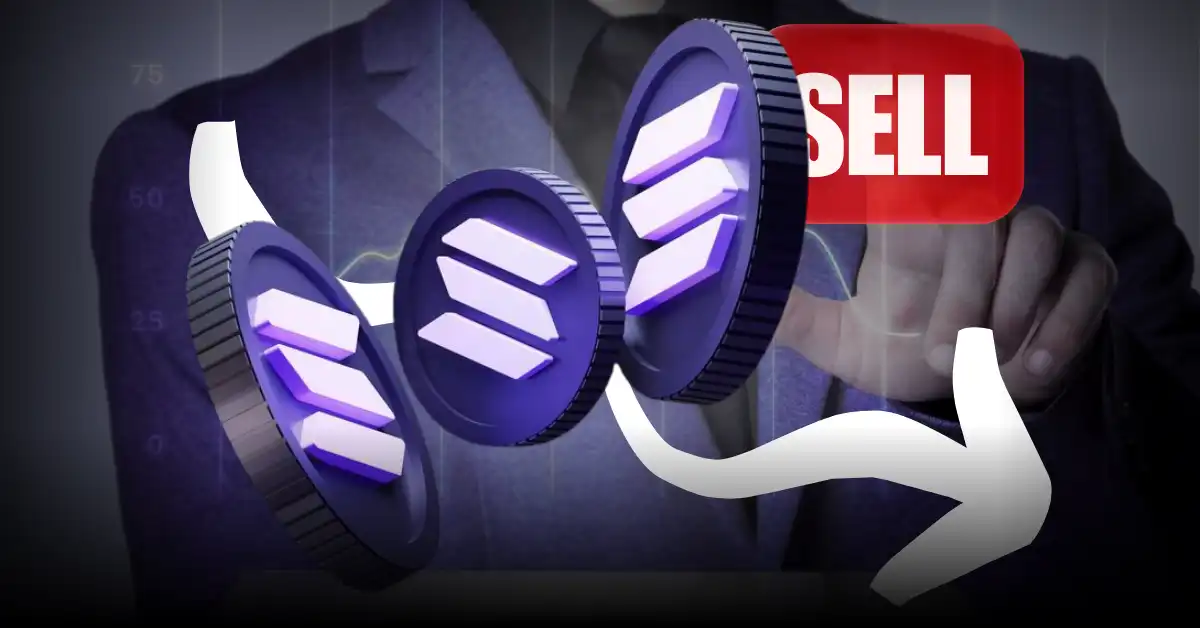
Solana price consolidates amid geopolitical tensions while a monthly chart “sell” signal raises higher-timeframe concerns.
Institutional positioning remains steady, but resistance at $110 and macro risk keep downside toward $60 in play.
Amid escalating geopolitical tensions in the Middle East and broader risk-off sentiment across crypto markets, the Solana price is once again under pressure and has slipped toward a critical support zone. At the same time, a higher-timeframe “sell” signal has emerged on the monthly chart, raising fresh concerns about downside continuation. The question now is simple:
Can Solana price stabilize here, or is a deeper decline unfolding? To answer that, the technical structure and capital flows need closer examination.
Monthly Chart Flashes Sell Signal: A Structural Warning
A key technical indicator on the monthly timeframe has triggered a sell signal, marking a potential shift in long-term momentum. Higher-timeframe signals carry more weight than short-term volatility. They typically reflect broader trend exhaustion rather than intraday noise. Historically, when similar signals have appeared on SOL’s monthly chart, price has either entered extended consolidation or corrective phases.
Instead, it signals that upside momentum has weakened structurally. If the current monthly candle closes under pressure, it would confirm that larger-cycle buyers are losing control. For now, the sell signal introduces caution, not panic, but it materially changes the medium-term outlook.
- Also Read :
- Bitcoin Consolidates Between $62K and $71K: Accumulation or Range Trap Before the Next Move?
- ,
Solana ETF Flows Suggest Institutional Exposure
Recent U.S. SOL Spot ETF data shows continued inflows, including a notable spike of over $30 million in a single session, followed by additional positive daily prints. Cumulative net inflows are approaching the $933 million mark, with total net assets remaining above $750 million.
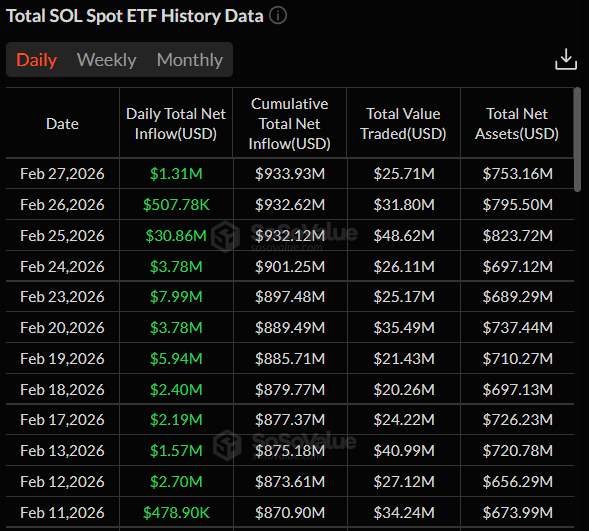
Institutional vehicles typically react decisively when systemic risk rises. The absence of aggressive outflows suggests that longer-term capital is not exiting in panic. Instead, positioning appears steady, possibly strategic.
This divergence between technical caution and institutional stability creates tension within the structure.
SOL’s Key Levels That Define the Move
Solana price is compressing within a descending channel and resting near horizontal support. Immediate support remains the $80–$85 demand zone. A decisive break below $80 opens downside exposure toward the next macro support near $60–$65, which previously acted as a structural base.
On the upside, the $95–$110 region represents the first major resistance cluster. This area aligns with prior breakdown structure, channel resistance, and short-term moving average confluence. A sustained close above $100 would weaken the immediate bearish bias and open a path toward $120. Until one of these levels breaks, compression continues, but pressure is building.
FAQs
Solana is under pressure due to broader risk-off sentiment in crypto markets and escalating geopolitical tensions in the Middle East, which are impacting risk assets globally.
No. Despite the price drop, Solana Spot ETF data shows continued inflows. This divergence suggests that longer-term institutional capital is holding steady rather than exiting in panic.
Solana needs a sustained close above the $95–$110 resistance cluster. A move above $100 would weaken the bearish bias and open a path toward $120.
Trust with CoinPedia:
CoinPedia has been delivering accurate and timely cryptocurrency and blockchain updates since 2017. All content is created by our expert panel of analysts and journalists, following strict Editorial Guidelines based on E-E-A-T (Experience, Expertise, Authoritativeness, Trustworthiness). Every article is fact-checked against reputable sources to ensure accuracy, transparency, and reliability. Our review policy guarantees unbiased evaluations when recommending exchanges, platforms, or tools. We strive to provide timely updates about everything crypto & blockchain, right from startups to industry majors.
Investment Disclaimer:
All opinions and insights shared represent the author's own views on current market conditions. Please do your own research before making investment decisions. Neither the writer nor the publication assumes responsibility for your financial choices.
Sponsored and Advertisements:
Sponsored content and affiliate links may appear on our site. Advertisements are marked clearly, and our editorial content remains entirely independent from our ad partners.