


 Advertise



Solana Price Eyes Recovery as Network Revenue, Stablecoin Supply Hit New Milestones




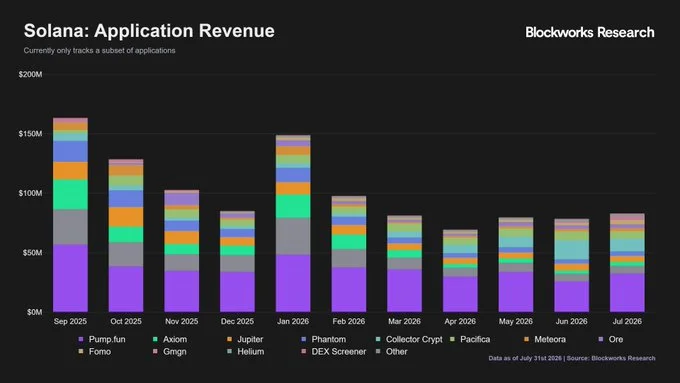
Solana apps generated $82.9M in July revenue, the highest level since February.
Stablecoin supply reached a record $15.7B, while memecoins made up about 25% of DEX volume.
Solana price is approaching key resistance near the 200-day EMA around $90.
The Solana price may still be trading well below previous highs, but activity across the network has a different theme. While the token climbed from June’s low of $60 to around $73.15 in early August, several on-chain indicators suggest the ecosystem has continued gaining momentum even as the market remains cautious.
Per data, the July has proved particularly active for the network, with revenue, stablecoin supply, and memecoin trading all moving higher.
Solana Network Activity Keeps Building Strength
The numbers paint a busy picture, with Solana applications generating $82.9 million in revenue during July, marking the highest monthly figure since February. At the same time, Solana’s share of total network revenue climbed to 16.5%, making it the third-largest blockchain by that metric and placing it ahead of Ethereum.
Meanwhile, stablecoin supply reached an all-time high of $15.7 billion, showing continued capital flowing into the ecosystem. Memecoins also returned to the spotlight, accounting for roughly 25% of all Solana DEX volume as trading activity rotated back into the sector.

Solana Technical Structure Shows Demand Returning
The Solana price hasn’t fully reflected the improving network metrics yet, but the chart has started showing subtle changes.
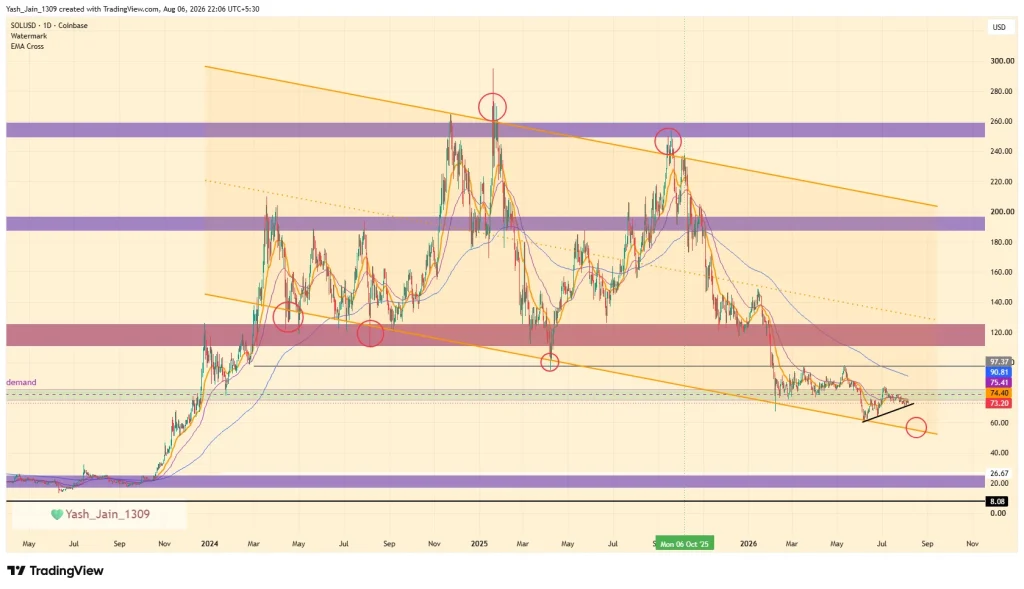
The Solana price tested an important support area in June, aligning with the lower boundary of a falling wedge pattern before rebounding toward the current range.
Another technical development attracting attention is the narrowing gap between the 50-day EMA and 200-day EMA bands. That typically indicates buying demand is beginning to close the gap with persistent selling pressure, although confirmation still depends on future price action.
Key Resistance Levels Come Into Focus
The next hurdle sits near the 200-day EMA around $90. Because it will be a turning point, if buyers manage to reclaim that level, higher resistance zones around $97, $110, and even $130 which is near the middle line of the falling wedge pattern that could become the next areas to watch.
The bearish alternative hasn’t disappeared, however. If momentum weakens again, the Solana price could revisit liquidity below $60, potentially extending toward $55 before attempting another recovery. For now, the combination of improving ecosystem metrics and strengthening technical structure suggests the market is watching whether fundamentals can finally translate that into price.
Was this writing helpful?

Trust with CoinPedia:
CoinPedia has been delivering accurate and timely cryptocurrency and blockchain updates since 2017. All content is created by our expert panel of analysts and journalists, following strict Editorial Guidelines based on E-E-A-T (Experience, Expertise, Authoritativeness, Trustworthiness). Every article is fact-checked against reputable sources to ensure accuracy, transparency, and reliability. Our review policy guarantees unbiased evaluations when recommending exchanges, platforms, or tools. We strive to provide timely updates about everything crypto & blockchain, right from startups to industry majors.
Investment Disclaimer:
All opinions and insights shared represent the author's own views on current market conditions. Please do your own research before making investment decisions. Neither the writer nor the publication assumes responsibility for your financial choices.
Sponsored and Advertisements:
Sponsored content and affiliate links may appear on our site. Advertisements are marked clearly, and our editorial content remains entirely independent from our ad partners.