- Shrishesh Tanksalkar
 Shrishesh Tanksalkar
- Sep 27, 2025 11:12 UTC
-
Shiba Inu Price Nears Make-or-Break Zone, Will it Fall to $0.0000115?
SHIB price rebounds from the June level, oversold RSI, but lags key moving averages.
Fed’s rate cut and Shibarium upgrade spur only modest, short-lived upside.
All eyes on $0.0000115 support: breakdown risks sharper correction ahead.
Shiba Inu price faces a crucial crossroads as technical and fundamental signals converge. Despite a minor price recovery of +1.32% over the last 24 hours to $0.00001181, SHIB is down 8.27% on the week. It also recently hit its lowest level since early August 2025.
The coin’s market cap sits at $6.96 billion with a 24-hour trading volume of $157.01 million, down nearly 37%. This reflects both cautious trader participation and emerging skepticism about a sustained rebound. Investors are closely monitoring whether SHIB can defend its $0.0000115 support level or succumb to broader market headwinds.
Shiba Inu Price Analysis
Shiba Inu’s price action remains a story of technical stress and cautious optimism. The 4-hour chart indicates that the RSI plunged to an oversold 33.9 on September 25. It’s lowest since June, a signal that triggered a modest bounce. However, the underlying trend is less encouraging, as SHIB remains below all moving averages.
This is with its 7-day EMA at $0.0000122 and the longer-term 200-day EMA distant at $0.000013. The MACD histogram remains negative at -0.000000174, showing continued bearish pressure and a lack of bullish momentum.
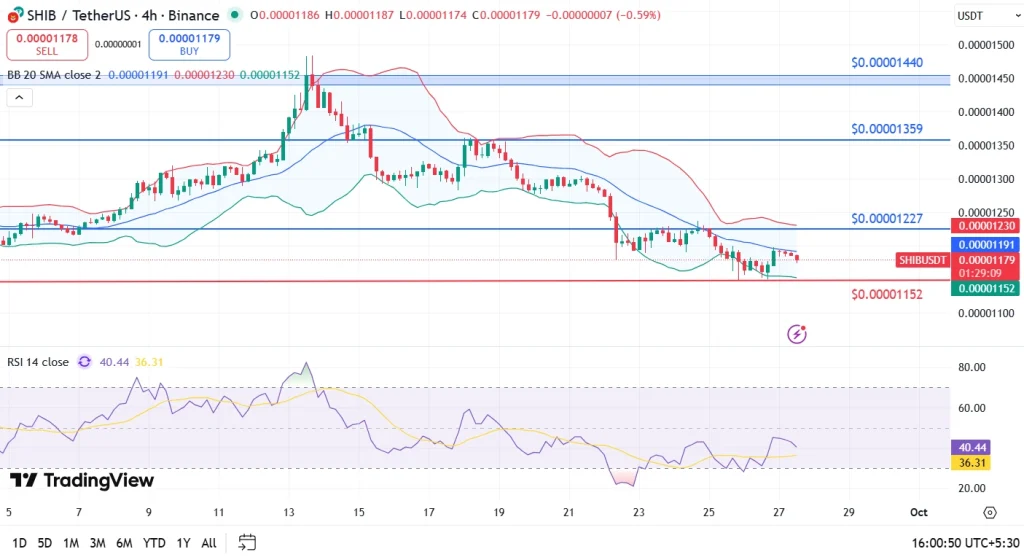
Although the Federal Reserve’s rate cut on September 17 injected optimism into speculative assets, SHIB’s rally has been lackluster. The price remains capped by resistance at $0.00001359. And the failure to close above the 7-day EMA dims chances for a near-term trend reversal. Notably, the 24-hour trading volume, while consistent with previous rate-cut rallies, is still 35% below SHIB’s 30-day average.
In summary, SHIB’s recent price action represents a technical rebound from oversold territory rather than a convincing recovery. With structural bearishness dominating, only a strong, sustained move above $0.0000122 would suggest any meaningful upside. Bears may seize control if SHIB breaks below the $0.0000115 support, especially if Bitcoin’s dominance surges.
FAQs
Shiba Inu’s price weakness stems from a combination of bearish technical signals, such as trading below key EMAs and a negative MACD. As well as waning Shibarium activity and overall market skepticism, despite a brief macro boost from the Fed’s rate cut.
Traders are focused on $0.0000115 as crucial support and $0.0000122 as near-term resistance.
The market might have viewed the security patch as important but insufficient to reignite enthusiasm.
Trust with CoinPedia:
CoinPedia has been delivering accurate and timely cryptocurrency and blockchain updates since 2017. All content is created by our expert panel of analysts and journalists, following strict Editorial Guidelines based on E-E-A-T (Experience, Expertise, Authoritativeness, Trustworthiness). Every article is fact-checked against reputable sources to ensure accuracy, transparency, and reliability. Our review policy guarantees unbiased evaluations when recommending exchanges, platforms, or tools. We strive to provide timely updates about everything crypto & blockchain, right from startups to industry majors.
Investment Disclaimer:
All opinions and insights shared represent the author's own views on current market conditions. Please do your own research before making investment decisions. Neither the writer nor the publication assumes responsibility for your financial choices.
Sponsored and Advertisements:
Sponsored content and affiliate links may appear on our site. Advertisements are marked clearly, and our editorial content remains entirely independent from our ad partners.