


 Advertise



LTC Price Tests Weekly Demand as Bulls Eye $80



LTC price found demand around $44 and reclaimed the weekly 20-EMA.
The weekly 50-EMA at $62.61 is the next resistance before the larger $80.56 barrier.
Meanwhile, improving AO, RSI and MACD suggest momentum is recovering, but confirmation remains limited.
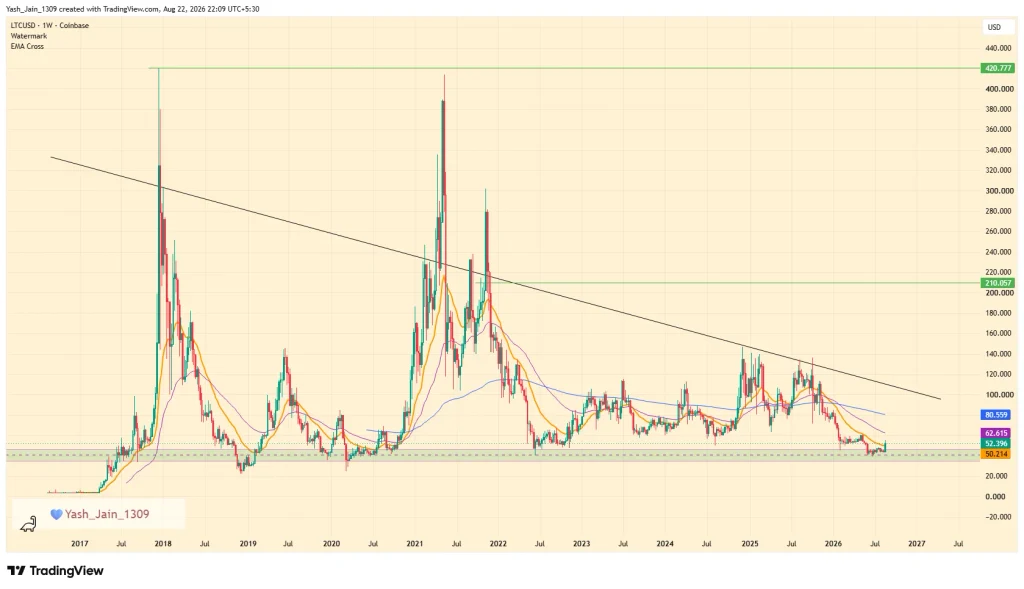
LTC price is showing signs of life after finding demand around $44, but the weekly chart still has a major problem overhead. The asset remains inside a descending triangle, while the recent recovery has pushed price above the 20-EMA and toward the 50-EMA near $62.61.
LTC Price Recovery Faces Its First Test
The $44 demand area matters because Litecoin has reacted from that zone before, and this week’s response suggests buyers haven’t completely disappeared. Still, a bounce is just a bounce until it proves otherwise.
The next hurdle sits at the weekly 50-EMA around $62.61. Clearing that level would give the recovery some breathing room, but the much bigger test is the 200-EMA near $80.56.
That level has the potential to decide whether this is merely another short-lived recovery or something more meaningful.

Descending Triangle Keeps The Bigger Picture Tight
The descending triangle remains central to the LTC price setup because its dynamic levels have previously influenced weekly price action. If LTC can reclaim the 200-EMA with sustained bullish demand, the next major objective could be the pattern’s upper boundary around $100.
For now, though, traders have plenty of reasons to stay cautious. The price is still below that long-term resistance, and failure to build follow-up demand could leave the recovery struggling.
Weekly Indicators Finally Start Turning Higher
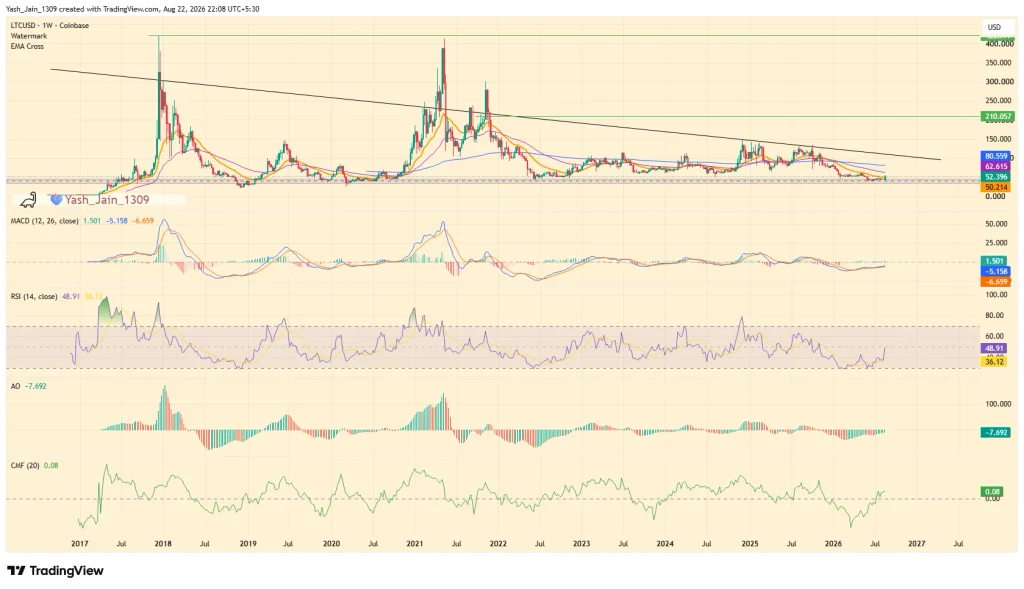
Momentum indicators are improving alongside the price. AO has recovered from -0.33 to 0.08, while RSI has climbed from 30 to 48.74, showing the sharp recovery from oversold conditions.
The AO histogram has also improved from -32.209 to -7.692, while MACD has produced a bullish cross, with the MACD line at -5.163 against the signal line at -6.660.
That’s encouraging, but not exactly a victory lap. For LTC price, the real confirmation still sits at $80.56. A sustained break could open the way toward $100, while failure to regain that weekly 200-EMA would leave the broader descending-triangle structure firmly in control.
Was this writing helpful?

Trust with CoinPedia:
CoinPedia has been delivering accurate and timely cryptocurrency and blockchain updates since 2017. All content is created by our expert panel of analysts and journalists, following strict Editorial Guidelines based on E-E-A-T (Experience, Expertise, Authoritativeness, Trustworthiness). Every article is fact-checked against reputable sources to ensure accuracy, transparency, and reliability. Our review policy guarantees unbiased evaluations when recommending exchanges, platforms, or tools. We strive to provide timely updates about everything crypto & blockchain, right from startups to industry majors.
Investment Disclaimer:
All opinions and insights shared represent the author's own views on current market conditions. Please do your own research before making investment decisions. Neither the writer nor the publication assumes responsibility for your financial choices.
Sponsored and Advertisements:
Sponsored content and affiliate links may appear on our site. Advertisements are marked clearly, and our editorial content remains entirely independent from our ad partners.