Sohrab Khawas

Sohrab Khawas

Author
Sohrab is a passionate cryptocurrency news writer with over five years of experience covering the industry. He keeps a keen interest in blockchain technology and its potential to revolutionize finance. Whether he's trading or writing, Sohrab always keeps his finger on the pulse of the crypto world, using his expertise to deliver informative and engaging articles that educate and inspire. When he's not analyzing the markets, Sohrab indulges in his hobbies of graphic design, minimal design or listening to his favorite hip-hop tunes.
- Jul 16, 2024 10:44 UTC
-
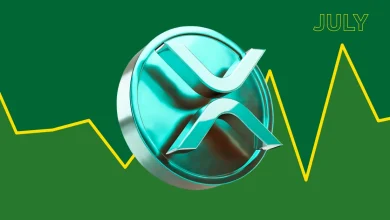
LINK Price Breakout Rally To Hit $20 As Whale Activity Grows

The LINK price trend shows a bullish reversal rally.
The bullish revival marks an end of correction with a trendline break.
An uptrend continuation could surpass the $21 peak.
With a bullish revival in the altcoins, the Chainlink token reflects a high momentum reversal rally. The LINK token price has increased by 16% in four days before taking an intraday hit of 2.14% today. As it trades at $14.095, the altcoin reveals a potential bull run to hit the $20 in the coming weeks.
Breaking the streak of four bullish candles on a high note of a 7% jump, sideline traders watch Chainlink carefully. So, will the bullish engulfing candle reinstate the bull run to $20? For a long-term view, check out our LINK price prediction.
Chainlink Price Performance
With a bullish revival as the crypto market bounces back, the LINK price shows a double-bottom reversal from the $12.242 support zone. The price jump accounts for a 13.73% rise in the last five days and tests the $14.50 neckline.
Furthermore, the LINK price action reveals a trendline breakout rally gaining momentum. However, the intraday drop warns of a retest phase of the broken resistance trendline.
As per the latest tweet of @ali_charts, a top crypto analyst, Chainlink whales have bought up over 10 million LINK tokens in the last two weeks. At current market prices, this accounts for almost $140 million.
Technical indicators:
MACD: The positive crossover in the MACD and signal lines with a bullish reversal approaching the zero line.
RSI: The daily RSI line shows an uptick in crossing above the halfway line. Further, it is on the way to hitting the overbought zone. Hence, the momentum indicators bolster the bull run possibility in LINK prices.
Will The LINK Price Cross $20?
Despite the intraday drop, the overall sentiment around Chainlink remains optimistic. With the whales buying more and the breakout rally gaining momentum, the LINK price shows a high potential to hit $20. However, the resistance level at $16.75 is a crucial supply zone to watch.
Also Check Out: Here’s Why Notcoin (NOT) Is The Altcoin To Buy For 50% Price Jump!