- Shrishesh Tanksalkar
 Shrishesh Tanksalkar
- Sep 19, 2025 06:28 UTC
-
IMX Crypto Price Surges 18% as Breakout Sparks Bullish Momentum

IMX price breaks multi-year triangle, targets $0.986 and $1.12 resistance
Netmarble and Web2 partnerships fuel bullish narrative for Immutable X
RSI at overbought levels suggests short-term consolidation ahead
Immutable X is making waves in the market this week. After months of quiet consolidation, the token has exploded with a double-digit gain. The move comes on the back of a decisive technical breakout and strong fundamental catalysts from new gaming partnerships. With trading volumes shooting up and market sentiment warming up, IMX is once again grabbing traders’ eyes. So without further ado, let’s dive into what’s driving this surge and what could come next.
What’s Driving IMX’s Rally?
In the latest Immutable X news, the team recently announced a partnership with Netmarble on September 11. This allows creators to earn rewards through popular games like Solo Leveling. Just days later, the co-founder hinted at major Web2 franchise integrations, potentially bringing anime and entertainment IPs onto the Immutable network. With 660 games and 5.6 million wallets already active, these deals could bring millions of new users into Web3 gaming.
Adding fuel to the steamy run, the Altcoin Season Index surged to 73, highlighting strong interest in mid-cap tokens. Successively, IMX’s 24-hour turnover ratio of 16.2% underlines high liquidity and speculative trading activity.
IMX Price Analysis
While I frame this analysis for you, IMX is trading at $0.8888, up 17.8% in the past 24 hours. The market cap has jumped to $1.72 billion, supported by a massive 76% surge in trading volume, now at $286.28 million.
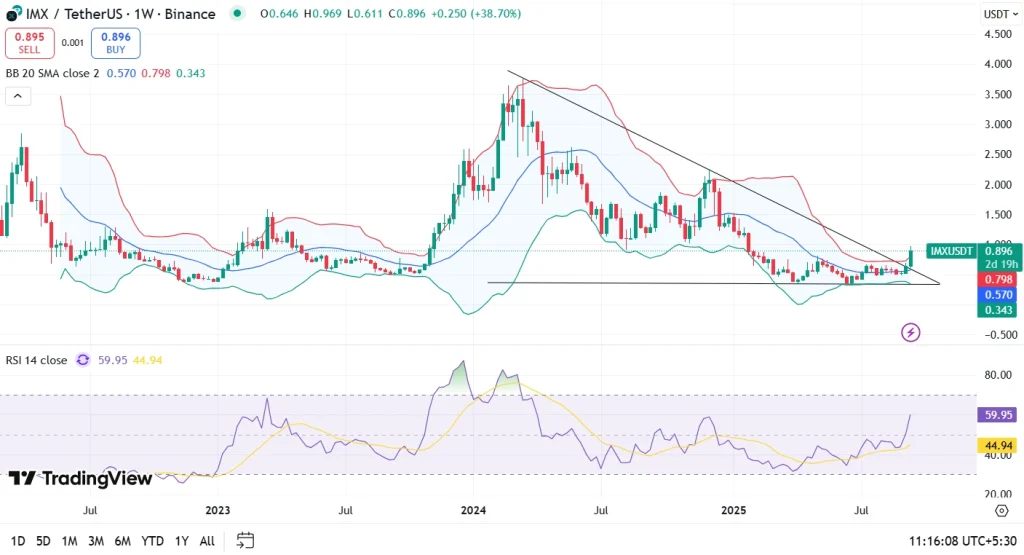
On September 16, IMX broke out of a multi-year symmetrical triangle pattern, a bullish setup that often marks the start of sustained rallies. The breakout was confirmed as the price pushed above both the 200-day EMA at $0.544 and the 61.8% Fibonacci retracement at $0.636. Momentum indicators also confirm the move, as RSI-14 is hovering in the overbought zone, while the MACD histogram shows widening green bars.
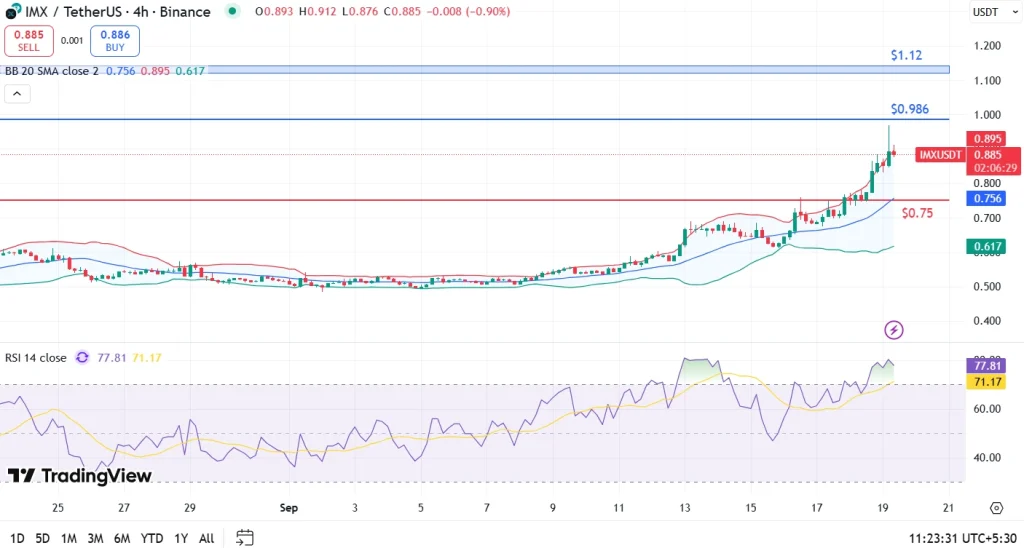
Looking ahead, the next resistance levels sit at $0.986 and $1.12. If IMX can clear these levels with volume support, it could extend gains toward the $1.20 mark. However, RSI divergence suggests that short-term consolidation is likely before another leg higher. Key support levels to watch are $0.756 and $0.75, which could act as buffers if profit-taking kicks in.
FAQs
The breakout from a multi-year triangle, combined with Netmarble and Web2 partnerships, triggered strong buying interest.
The immediate targets are $0.986 and $1.12, based on Fibonacci extensions.
Yes, the RSI is in the overbought zone, suggesting a possible short-term pullback before further gains.
Trust with CoinPedia:
CoinPedia has been delivering accurate and timely cryptocurrency and blockchain updates since 2017. All content is created by our expert panel of analysts and journalists, following strict Editorial Guidelines based on E-E-A-T (Experience, Expertise, Authoritativeness, Trustworthiness). Every article is fact-checked against reputable sources to ensure accuracy, transparency, and reliability. Our review policy guarantees unbiased evaluations when recommending exchanges, platforms, or tools. We strive to provide timely updates about everything crypto & blockchain, right from startups to industry majors.
Investment Disclaimer:
All opinions and insights shared represent the author's own views on current market conditions. Please do your own research before making investment decisions. Neither the writer nor the publication assumes responsibility for your financial choices.
Sponsored and Advertisements:
Sponsored content and affiliate links may appear on our site. Advertisements are marked clearly, and our editorial content remains entirely independent from our ad partners.