- Shubham Vishwakarma
 Shubham Vishwakarma
- Jan 10, 2026 06:51 UTC
-
GMT Coin Price Jumps as Breakout Sparks Bullish Sentiment: Bigger Move Ahead?
GMT price posted 40% gains in a week, sparking bullish sentiment.
Key technical indicators and derivatives data favors more upside ahead.
As the new year begins, GMT has entered the 2026 with renewed strength, surprising the market posting 40% gains within a week. After months of price consolidation and sustained downward trend, GMT price finally showed signs of trend reversal.
This upward move marked a clear shift in market sentiment, as buyers stepped in aggressively and pushed GMT price higher with rising volume.
With the rally now in play, let’s look at what GMT price action and key technical indicators are signaling next.
GMT Price Chart Flash Bullish Signals as Momentum Accelerates
GMT price action has finally shown a shift in structure after moving sideways for several weeks. The token broke out from a consolidation range and posted 40% gains in a week.
The token has started to form a higher high followed by a higher low, signaling that buyers are gaining traction.
Currently, GMT price trades at $0.02260 with an intraday surge of 30%. The 24-hour volume surged massively over 1020% to $326.49 Million denoting massive trader participation.

Looking at the chart setup, GMT price has registered a range this week with strong volume spurt. The 20 EMA has started to curl upward, while the 50 EMA is acting as immediate support on pullbacks. As long as the price holds above these two EMAs, the bullish bias remains intact.
However, GMT price was trading inside a multi-month falling channel and the 100 EMA still sits overhead, acting as a near-term resistance zone.
For now, price action favors bulls, with upside continuation remaining a strong possibility that GMT price may break the trendline barrier of $0.2600 in coming sessions.
Looking at the key indicators, the Relative Strength Index (RSI) has moved in the overbought zone, displaying bullish momentum.
Moreover, the CMF indicator also flipped into the positive territory, indicating steady capital inflows.
Moreover, GMT’s liquidation data from Coinglass denotes a massive short squeeze in action.
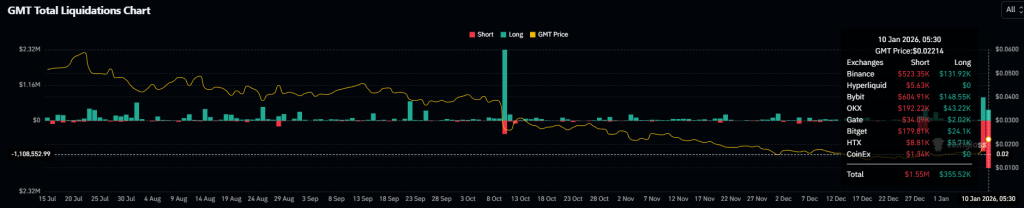
Over $1.55M of short positions were liquidated versus $355k of longs in the past 24 hours. This often confirms a bullish momentum.
Furthermore, the Open Interest (OI) rose sharply over 245% to $55.08M, denoting massive bets on long side positions.
Final Thoughts
GMT’s recent breakout and improving market structure could allow it to extend its recovery toward the 0.02600 barrier. If bullish momentum continues, GMT price may continue to push higher and may reach $0.0300 followed by $0.03600 ahead.
Trust with CoinPedia:
CoinPedia has been delivering accurate and timely cryptocurrency and blockchain updates since 2017. All content is created by our expert panel of analysts and journalists, following strict Editorial Guidelines based on E-E-A-T (Experience, Expertise, Authoritativeness, Trustworthiness). Every article is fact-checked against reputable sources to ensure accuracy, transparency, and reliability. Our review policy guarantees unbiased evaluations when recommending exchanges, platforms, or tools. We strive to provide timely updates about everything crypto & blockchain, right from startups to industry majors.
Investment Disclaimer:
All opinions and insights shared represent the author's own views on current market conditions. Please do your own research before making investment decisions. Neither the writer nor the publication assumes responsibility for your financial choices.
Sponsored and Advertisements:
Sponsored content and affiliate links may appear on our site. Advertisements are marked clearly, and our editorial content remains entirely independent from our ad partners.