- Steve Muchoki
 Steve Muchoki
- Apr 22, 2025 19:57 UTC
-
Ethereum Price Analysis Today: key Short-term Targets for ETH to Consider Ahead
On-chain data shows whales have been accumulating Ether relentlessly in the last few days.
ETH price has to consistently close above $1,687 in the coming days to invalidate the multi-week correction.
Ethereum has continued to bleed to Solana, and the trend is likely to continue in the coming months.
Ethereum (ETH) price followed Bitcoin (BTC) in a bullish outlook on Tuesday, April 22, potentially ending a multi-week market correction. The large-cap altcoin, with a fully diluted valuation of about $205 billion, recorded a 36 percent surge in its 24-hour average trading volume to hover about $20B at the time of this writing.
For the first time since April 6, Ether’s price rallied beyond $1.7k on Tuesday during the mid-North American session.
Ethereum Whales Gradually Return
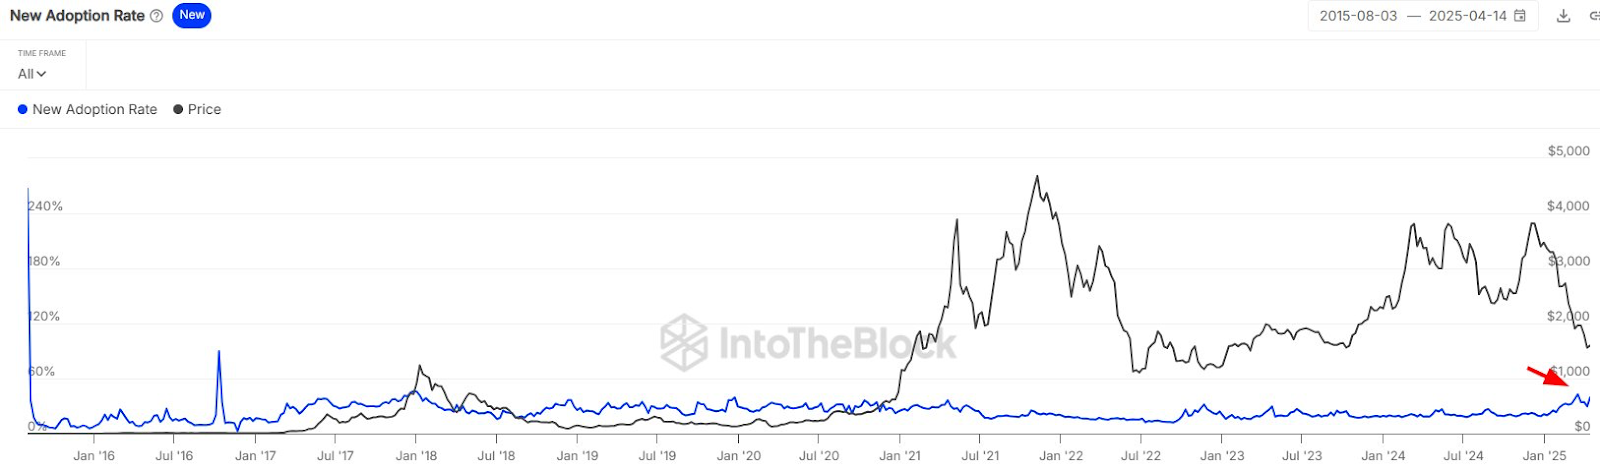
According to market data from Intotheblock, Ethereum’s adoption rate has gradually grown, signaling potential decoupling from crazy speculation. The rising tokenization of real-world assets (RWAs) on the Ethereum network has helped increase on-chain activity and attract more whale traders.
On-chain data by Lookonchain shows a whale investor has accumulated 48,477 ETH from crypto exchanges since Feb 15, and is currently sitting on a loss of about $21 million. Meanwhile, cash outflow from U.S. spot Ether ETFs has significantly declined in the past few days, signaling growing market confidence.
Midterm Ether Price Target
For the first time since the second inauguration of U.S. President Donald Trump, Ether price, against the U.S. dollar pierced through the daily falling logarithmic trend. After establishing a robust support level above $1,500 in the past two weeks, Ether’s price is well primed for a market reversal.
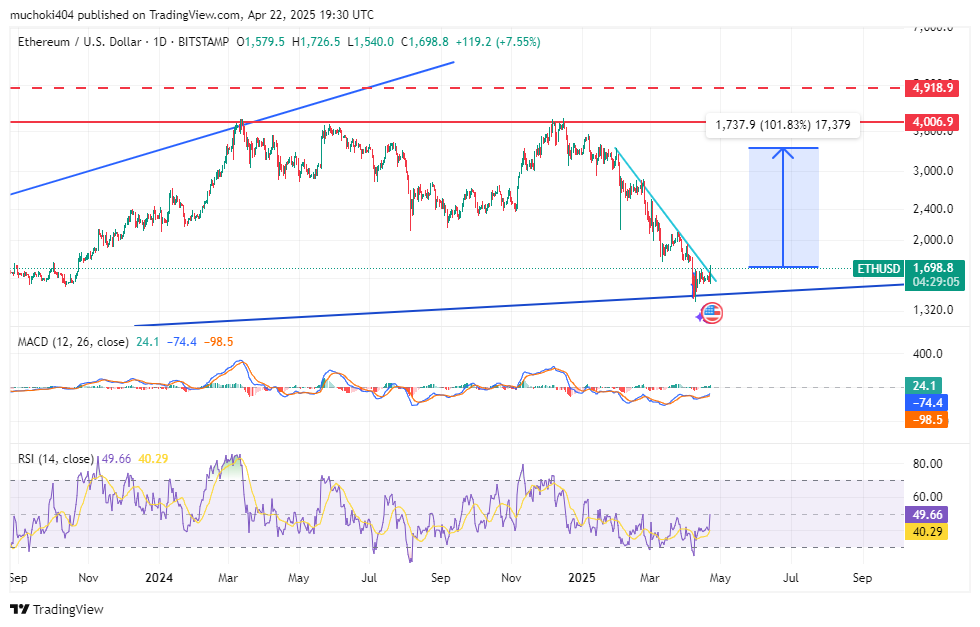
From a technical analysis standpoint, the daily MACD indicator is approaching the bullish flippening zone. Meanwhile, the daily Relative Strength Index (RSI) has been forming a bullish divergence and a reversal will be confirmed if the indicator consistently closes above the 50 percent level.
Never Miss a Beat in the Crypto World!
Stay ahead with breaking news, expert analysis, and real-time updates on the latest trends in Bitcoin, altcoins, DeFi, NFTs, and more.