Chainlink Stuck Below $10: How Long Will LINK Price Stay Range-Bound?


Chainlink continues forming higher lows, maintaining an ascending structure, but price remains capped below the $10 resistance, signaling controlled bullish pressure.
Price action is tightly compressed within the range, suggesting a breakout ahead, but weak momentum indicates the move may take longer to unfold.
Chainlink price initially crashed hard in the past few days, sliding from $9.30 to $8.70, following heavy selling pressure. The downturn wiped out weak hands, and as the market sentiment turned bullish, the LINK Marines are back in action. Currently, the LINK price is not just consolidating but is cooling. The popular DeFi token is stabalising below $10, while the structure is tightening and pressure is mounting.
The real question now is whether this setup resolves into a breakout or turns into a breakdown.
On the daily timeframe, the LINK price is trading just below the psychological barrier at $10, holding within a horizontal range between $8.4 and $9.6. At the same time, the price is forming higher lows within an ascending channel, indicating gradual strength building beneath resistance. This creates a classic compression structure where horizontal resistance meets rising support.
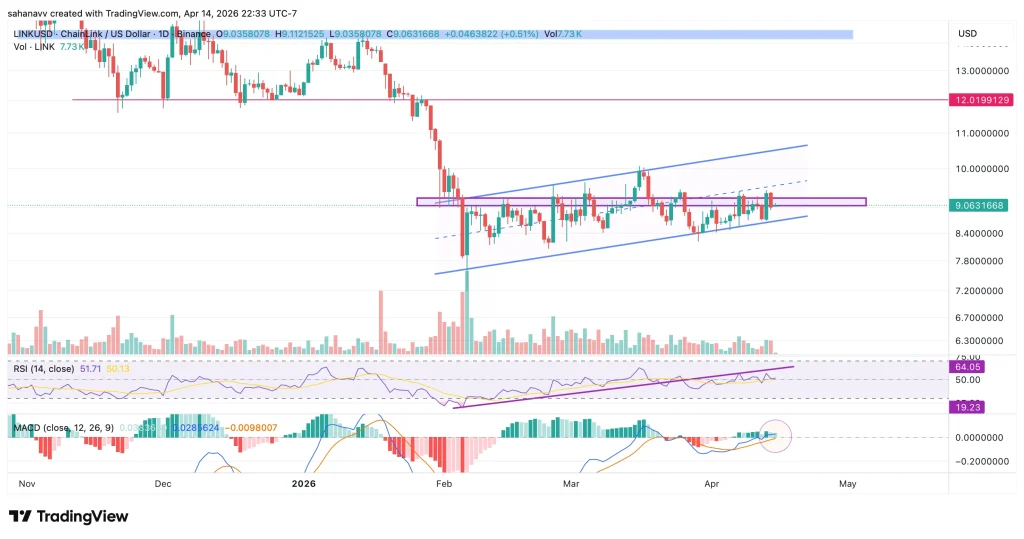
The chart reveals a coiling pattern, often seen before a decisive move.

- Range Structure: LINK continues to respect the $8.4–$9.6 zone, with multiple rejections on both sides. This confirms a well-defined accumulation range.
- Ascending Channel: Higher lows suggest buyers are stepping in earlier on each dip. This is not typical of a weak market—it signals underlying demand.
- Resistance Pressure (~$9.6–$10): Price is repeatedly testing the upper range. The more a level is tested, the weaker it becomes—raising the probability of a breakout.
- RSI Trend: RSI is forming higher lows and pushing toward bullish territory. Momentum is gradually shifting in favor of buyers.
- MACD Shift: MACD is curling upward near the zero line, hinting at a potential bearish crossover. This often precedes expansion phases.
All signals point to compression with a bullish tilt. Higher lows and rising momentum show buyers are gaining strength, while repeated tests of resistance indicate weakening supply. This structure typically resolves with a strong move. However, confirmation is still key—a break above $10 triggers upside, while a loss of $8.4 flips the bias bearish.
Key Levels That Matter
- Resistance: $9.6 – $10
- Breakout confirmation: Strong close above $10
- Upside targets: $11 → $12
- Support: $8.4
- Invalidation: Breakdown below $8.4
Was this writing helpful?
Trust with CoinPedia:
CoinPedia has been delivering accurate and timely cryptocurrency and blockchain updates since 2017. All content is created by our expert panel of analysts and journalists, following strict Editorial Guidelines based on E-E-A-T (Experience, Expertise, Authoritativeness, Trustworthiness). Every article is fact-checked against reputable sources to ensure accuracy, transparency, and reliability. Our review policy guarantees unbiased evaluations when recommending exchanges, platforms, or tools. We strive to provide timely updates about everything crypto & blockchain, right from startups to industry majors.
Investment Disclaimer:
All opinions and insights shared represent the author's own views on current market conditions. Please do your own research before making investment decisions. Neither the writer nor the publication assumes responsibility for your financial choices.
Sponsored and Advertisements:
Sponsored content and affiliate links may appear on our site. Advertisements are marked clearly, and our editorial content remains entirely independent from our ad partners.