- Yash Jain
 Yash Jain
- Mar 05, 2026 16:22 UTC
-
Chainlink Price Gains Attention After Visa e-HKD Pilot and LINK Chart Signals Possible Breakout
Chainlink helped complete a cross-border settlement pilot under Hong Kong’s e-HKD program.
The initiative linked Visa, ANZ, ChinaAMC, and Fidelity International through its oracle network.
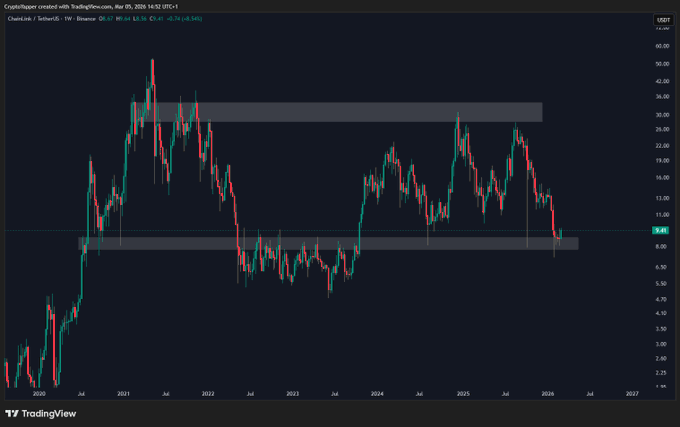
LINK bounced from the $9–$10 support zone with potential targets at $15 and $26.
The Chainlink price is suddenly back in the spotlight and not just because of a chart bounce. This time, the story comes straight from the intersection of crypto infrastructure and traditional finance.
A recent update revealed that a cross-border settlement pilot under Hong Kong’s e-HKD program has been completed. And yes, it involved some heavyweight names: Visa, ANZ, ChinaAMC, and Fidelity International. The connective tissue tying it all together? Chainlink crypto’s oracle network.
On paper, the initiative focused on enabling atomic and compliant transfers of tokenized funds. In simpler terms: programmable money moving across borders with reduced counterparty risk and near-real-time settlement. Visa’s interim report and Chainlink’s platform documentation detail how the infrastructure handled regulated asset transfers within the program.
That’s not just another blockchain experiment. It’s a test run of how financial institutions might actually move money in the tokenized future.
Traditional Finance Quietly Tests Chainlink
Let’s be honest crypto has promised to “revolutionize finance” for years. Most of the time, that claim lives somewhere between marketing hype and speculative optimism.
But occasionally, real infrastructure work appears.
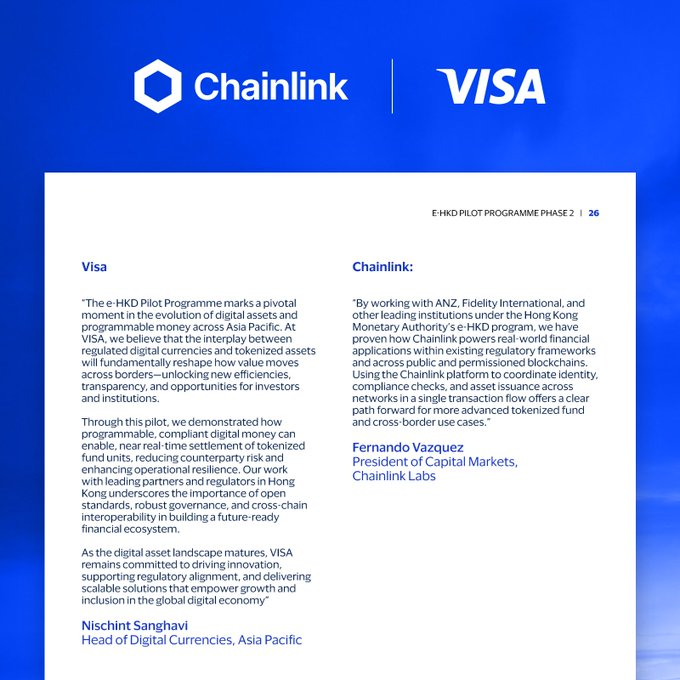
This pilot under Hong Kong’s e-HKD program shows how programmable money might operate in the Asia-Pacific region. By linking financial institutions through Chainlink’s oracle network, the system demonstrated near-instant settlement for tokenized funds while reducing settlement risk.
In traditional finance, settlement delays can create exposure between parties. Programmable transactions remove that uncertainty by executing transfers atomically meaning they either complete entirely or not at all.
And here’s the most highlighting detail: it’s not just a theory anymore.Institutions are testing it.
Chainlink Price Chart Shows Recovery
While the institutional narrative unfolds, the Chainlink price chart is quietly showing signs of life.
A weekly chart shared online highlights how LINK recently bounced from a critical $9–$10 support zone after previous declines. That range appears to have acted as a foundation for a potential recovery.
Now the asset is trading inside a parallel range structure. If momentum continues upward, the first technical target sits around $15. Push beyond that, and the upper boundary of the range appears closer to $26.
Of course, markets rarely move in straight lines. Resistance zones tend to attract sellers, especially after sharp recoveries.
Still, for traders watching LINK/USD, the support rebound has become the key talking point behind the latest Chainlink price prediction circulating across the market.
Utility Narrative Meets Market Momentum
So what’s really happening here? Well, here’s the interesting part. Institutional experimentation with programmable money is happening at the same time the market structure for LINK is attempting a recovery.
Correlation doesn’t equal causation, obviously. But the combination tends to attract attention.
If price holds above the $9–$10 base and momentum continues building inside the range, the next move on the chart could determine whether the current rebound becomes a trend.
For now, both narratives first the infrastructure progress and second the technical setup are converging around the same topic: the direction of the Chainlink price.
Trust with CoinPedia:
CoinPedia has been delivering accurate and timely cryptocurrency and blockchain updates since 2017. All content is created by our expert panel of analysts and journalists, following strict Editorial Guidelines based on E-E-A-T (Experience, Expertise, Authoritativeness, Trustworthiness). Every article is fact-checked against reputable sources to ensure accuracy, transparency, and reliability. Our review policy guarantees unbiased evaluations when recommending exchanges, platforms, or tools. We strive to provide timely updates about everything crypto & blockchain, right from startups to industry majors.
Investment Disclaimer:
All opinions and insights shared represent the author's own views on current market conditions. Please do your own research before making investment decisions. Neither the writer nor the publication assumes responsibility for your financial choices.
Sponsored and Advertisements:
Sponsored content and affiliate links may appear on our site. Advertisements are marked clearly, and our editorial content remains entirely independent from our ad partners.