- Shubham Vishwakarma
 Shubham Vishwakarma
- Feb 17, 2026 12:51 UTC
-
Chainlink (LINK) Enters Decision Zone Near $9: Which Side Wins Control?
Chainlink stabilizes near $8.7 as selling pressure fades around a key demand zone.
On-chain flows cool and leverage resets, setting up a decisive move from compression.
After the recent market pullback, crypto majors have moved into consolidation rather than continuation. Chainlink (LINK) price action reflects that shift clearly. The drop below $9 initially looked like a breakdown, yet the market refused to accelerate lower. With LINK price stabilizes near $8 and participation thinning, attention shifts beneath the surface to positioning and liquidity behaviour. The key question is no longer why LINK fell, but whether the token is preparing for continuation or reversal.
Exchange Netflows Data Signals Supply Absorption
On-chain exchange netflow activity shows a structural change compared to earlier in the month. During the previous decline, each move down was accompanied by visible token inflows to exchanges, a classic distribution pattern where holders prepare liquidity for selling. Those inflows coincided with impulsive downward candles and expanding ranges. Now the trend has shifted. As LINK price revisited the $8.5–$8.8 region, deposits stopped expanding and began flattening. The absence of fresh supply while price tests support indicates that the sell-side inventory responsible for the drop has largely been delivered.
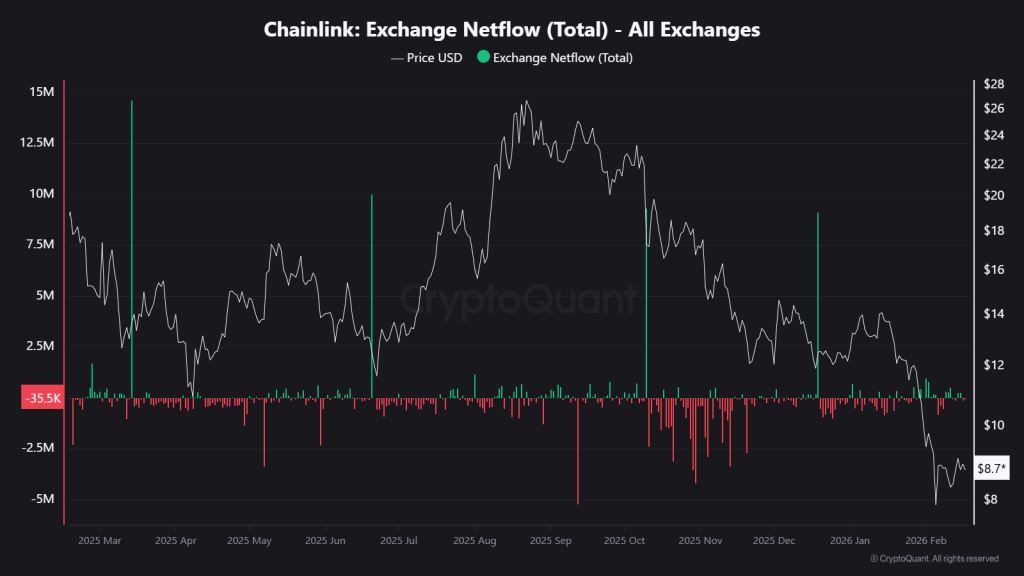
In on-chain terms, the market moved from active distribution to passive holding. This distinction matters more than the price itself. Markets fall quickly when supply is continuously replenished; they stabilize when the available inventory gets absorbed. The current flow profile suggests sellers are no longer pressing the bid, leaving price dependent on demand rather than forced selling. If inflows remain muted, the $8.5 zone behaves as an accumulation band. A renewed increase in deposits would instead signal redistribution and reopen downside toward lower liquidity pockets near $8.0. At present, on-chain behavior leans toward absorption rather than continuation.
Chainlink (LINK) Price Eyes Range Breakout: Can Bulls Succeed?
For months, Chainlink price has been capped inside a descending channel, marking a sequence of lower highs and lower lows, a directional trend where rallies failed quickly. Since then, LINK price has been trending downwards, but recently it stabilizes near the demand zone above $8 and has been rotating horizontally between $8 support and $9.3 resistance, forming a short-term range after a breakdown attempt. This type of behaviour is typically classified as a post-trend balance phase, the market deciding whether the prior move was overextended.
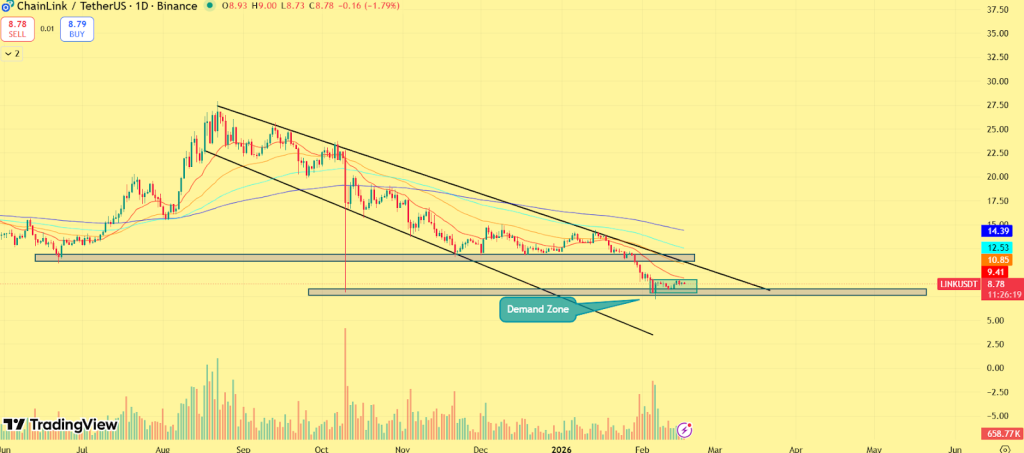
A reclaim above $9.2 would invalidate the breakdown and pull price back inside the prior trading range. In market structure terms, that converts the move into a deviation and often leads to a rotation toward $9.8–$10.2, where the previous consolidation base formed earlier in the month. Failure at $8.0, however, would confirm acceptance below support and expose the next demand band near $7.9–$8.1. The structure therefore does not yet show reversal or continuation, it shows compression before expansion.
Liquidation Map Reveals Next Trigger Zone
Liquidation data now shows where the next expansion is most likely to occur. The heaviest long liquidation cluster sits just below price around $8.40–$8.55, meaning a breakdown into that pocket could trigger forced selling and accelerate a quick flush toward the lower range. Above the current price, dense short liquidations are stacked between $9.05 and $9.40. That zone acts as a magnet if buyers regain control, since breaking into it would force short positions to close and fuel momentum upward.
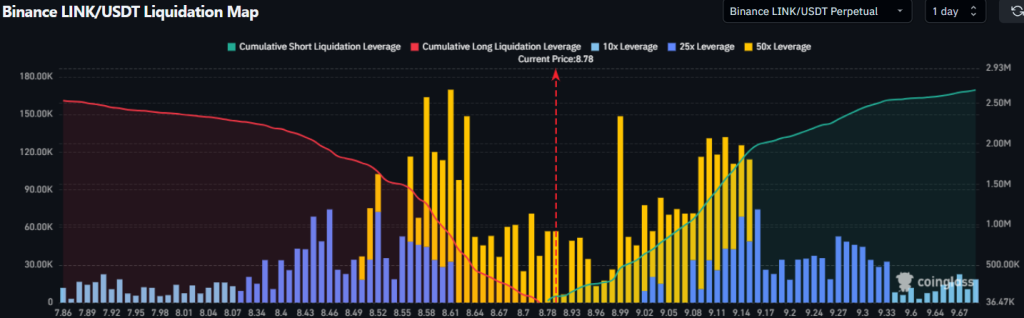
With price hovering near $8.7–$8.9, LINK is effectively positioned between two liquidity pools. The market is not trending, it is deciding which side gets liquidated next. The next move is likely to be decisive because the compression phase rarely lasts, they resolve quickly once one side regains conviction.
FAQs
Chainlink is currently compressing between $8.0 support and $9.3 resistance. A breakout above $9.2 could trigger a rally toward $10, while a breakdown below $8.0 might lead to a flush toward lower demand zones near $7.9.
A breakout above $9.2 may push LINK toward $9.8–$10.2, while a drop below $8 confirms lower support near $7.9–$8.1.
Long liquidations near $8.4–$8.55 and short clusters at $9.05–$9.4 create potential triggers for fast price moves depending on market direction.
LINK is in a compression phase, rotating in a short-term range; the next decisive move depends on which liquidity pool—buyers or sellers—prevails.
Trust with CoinPedia:
CoinPedia has been delivering accurate and timely cryptocurrency and blockchain updates since 2017. All content is created by our expert panel of analysts and journalists, following strict Editorial Guidelines based on E-E-A-T (Experience, Expertise, Authoritativeness, Trustworthiness). Every article is fact-checked against reputable sources to ensure accuracy, transparency, and reliability. Our review policy guarantees unbiased evaluations when recommending exchanges, platforms, or tools. We strive to provide timely updates about everything crypto & blockchain, right from startups to industry majors.
Investment Disclaimer:
All opinions and insights shared represent the author's own views on current market conditions. Please do your own research before making investment decisions. Neither the writer nor the publication assumes responsibility for your financial choices.
Sponsored and Advertisements:
Sponsored content and affiliate links may appear on our site. Advertisements are marked clearly, and our editorial content remains entirely independent from our ad partners.