Chandan Gupta

Chandan Gupta

Author
- Mar 27, 2025 04:08 UTC
-
Cardano (ADA) Price Prediction for March 27

ADA, the native token of the Cardano blockchain, continues its prolonged consolidation. For weeks, the asset has been moving within a tight range, between $0.69 and $0.75.
Cardano (ADA) Technical Analysis and Upcoming Levels
However, during this period, ADA has recorded several fakeouts, which now appear confusing to traders and investors trying to determine its upcoming move. According to expert technical analysis, the asset remains neutral and is currently at the upper boundary of the consolidation.
Based on recent price action and historical momentum, if ADA breaches the upper boundary and closes a daily candle above the $0.76 level, there is a strong possibility that it could soar by 13% to reach $0.85 in the coming days.
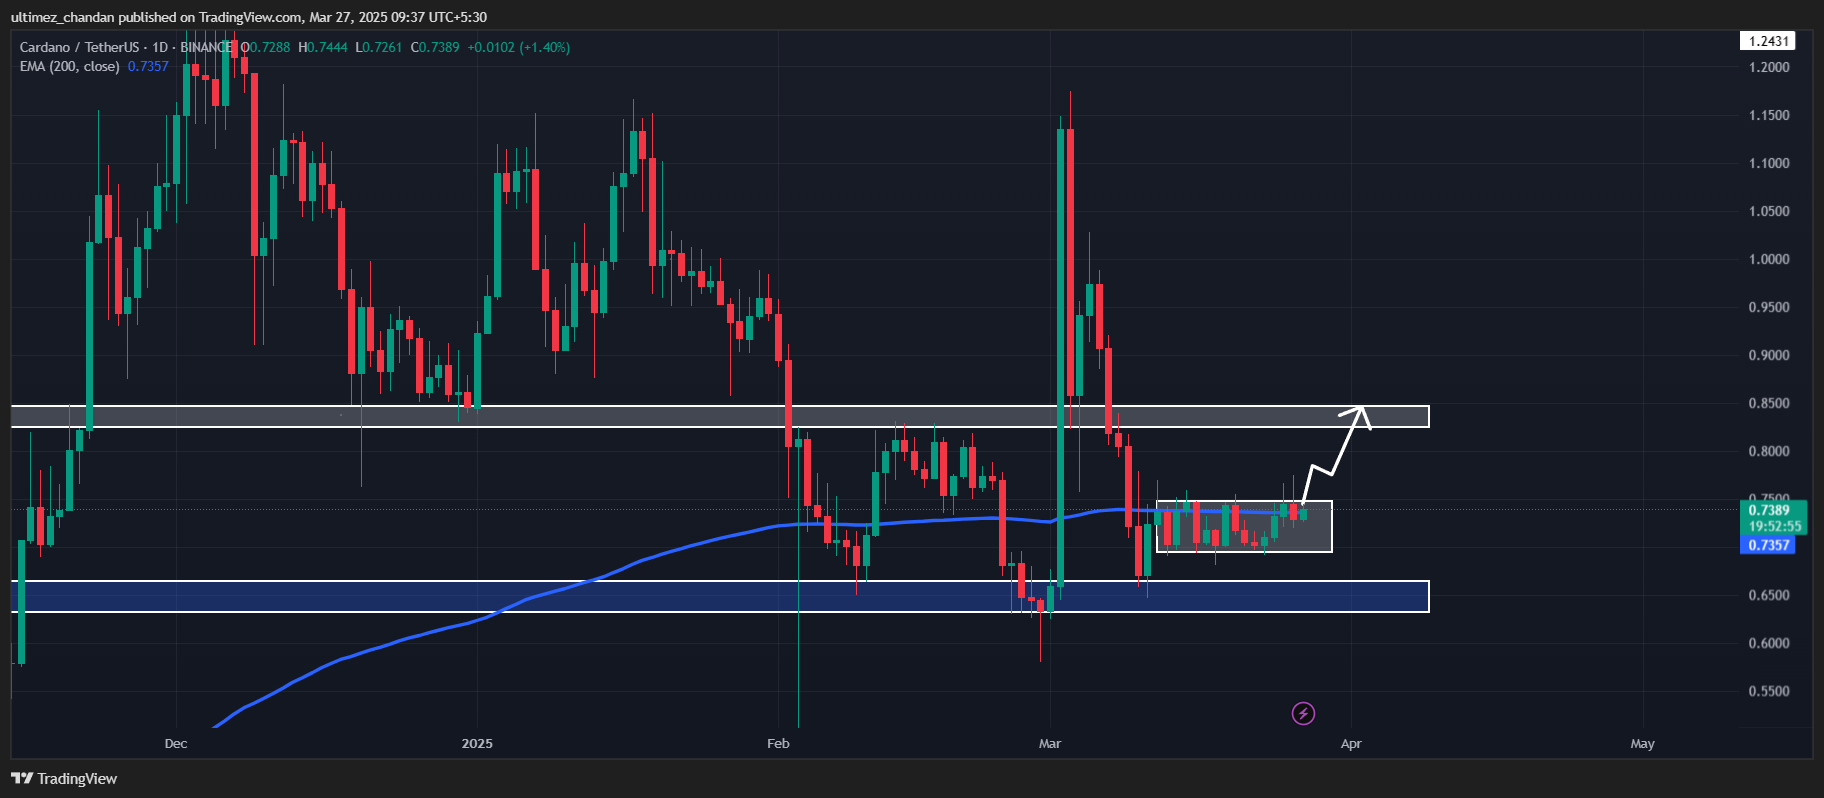
However, this rally is currently halted by the upper boundary of $0.75 and the 200 Exponential Moving Average (EMA) on the daily timeframe, which has been providing constant resistance.
Despite this neutral price action, a technical indicator called the Bollinger Bands on the 12-hour timeframe appears to be squeezing, signaling a potential upside or downside rally.
Current Price Momentum
At press time, ADA is trading near $0.742, having recorded a modest price surge of over 0.25% in the past 24 hours. However, during the same period, due to its high volatility, trading volume dropped by 18%, indicating that traders and investors are hesitant to participate in the token.
$13.75 Million Worth of ADA Outflow
Despite ongoing price consolidation, whales and long-term holders appear optimistic as they continue accumulating ADA, according to on-chain analytics firm Coinglass.
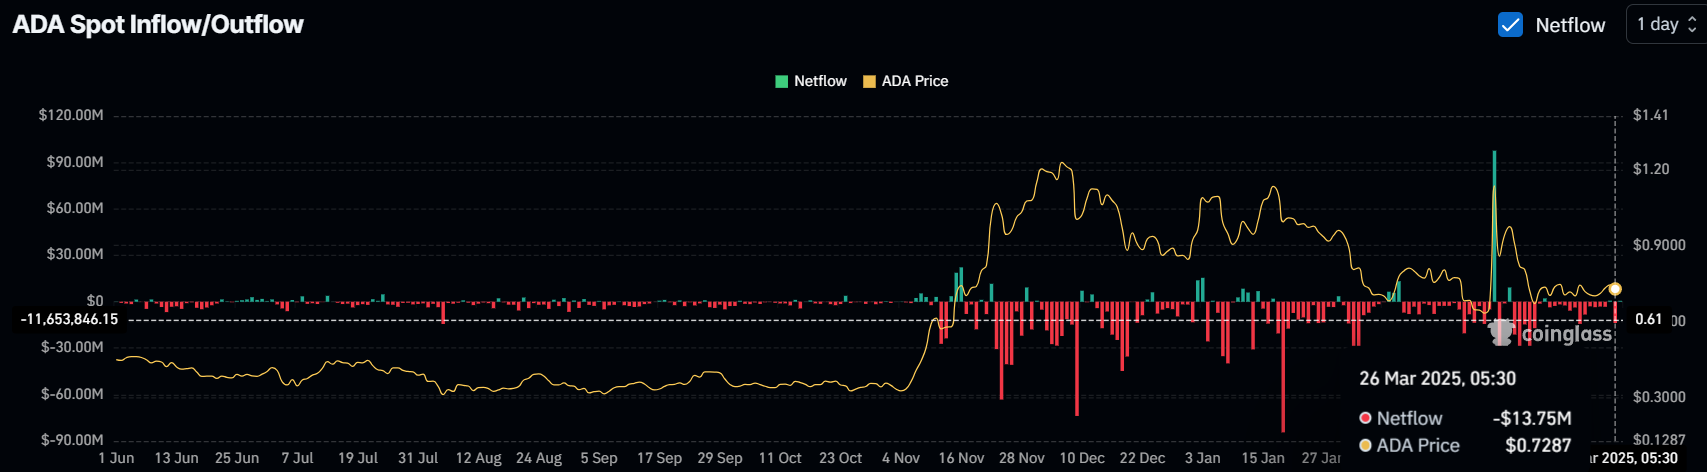
Data from spot inflow/outflow reveals that exchanges have witnessed an outflow of $13.75 million worth of ADA tokens in the past 24 hours, indicating potential accumulation. Meanwhile, such outflows from exchanges during a period of weak market sentiment reduce selling pressure and could trigger an upside move.