- Shrishesh Tanksalkar
 Shrishesh Tanksalkar
- Sep 20, 2025 11:29 UTC
-
BNB Price Holds Near $1,000 as Bulls Eye Another Fresh Breakout
BNB price retails at $999.95, just below its all-time high at $1,005.29
RSI nears overbought territory, hinting at possible short-term cooling
Institutional buys and Fed rate cut fuel latest BNB rally
BNB price has been on an impressive run, climbing 6.21% over the past week and now hovering around $999.95. The token briefly touched a new all-time high at $1,005.29 just two days ago and is now trading within touching distance of that level again.
With a $138.89 billion market cap and daily trading volume of $3.01 billion, BNB is holding its ground despite some cooling in broader market activity. The big question now is whether BNB can sustain momentum and break into fresh price discovery.
Where Does the Drive Come From?
The rally hasn’t come without strong backing. Blockchain experts recently allocated $50 million to Apollo’s tokenized credit fund on BNB Chain. This is while Nano Labs disclosed a $90 million BNB treasury purchase last month. These moves not only justify BNB’s role in real-world asset tokenization but also reduce its circulating supply, adding to buying pressure. Market chatter suggests Windtree Therapeutics and BNC may also announce BNB acquisitions, which could further strengthen demand.
On the macro side, the Fed’s 25bps rate cut on September 18 triggered a crypto-wide rally. BNB gained 2.78% post-announcement, though it slightly lagged behind Bitcoin’s 1.45% move. This hints at some sector rotation toward Bitcoin ETFs, which could limit BNB’s upside in the short term.
BNB Price Analysis
BNB’s price breakout above the critical $964.57 Fibonacci retracement level has confirmed bullish momentum. Technical traders often see this as a strong signal to go long, especially with the MACD histogram printing +8.38, pointing to accelerating upward momentum. At the same time, the RSI sits around 68, edging closer to the overbought zone. This suggests the token could face short-term consolidation before making another leg higher.
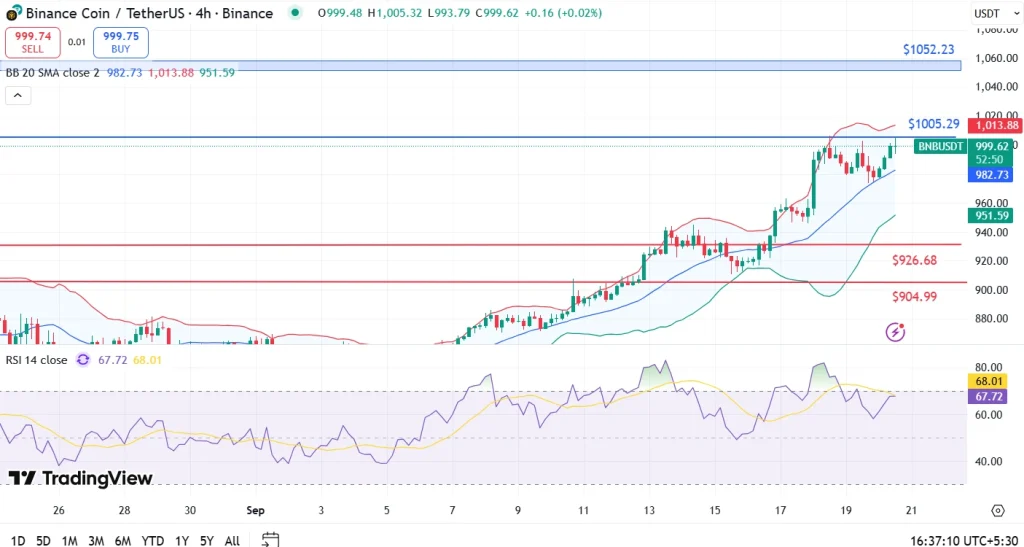
On the upside, a sustained close above $1,005.29 would likely open the path to the next key target at $1,052.23, based on the 127.2% Fibonacci extension. On the downside, support lies near $951.59, with deeper cushions at $926.68 and $904.99.
FAQs
The next major resistance is $1,005.29, followed by $1,052.23.
The RSI is near 70, suggesting BNB could see short-term cooling.
Institutional purchases, tokenized credit funds, and the Fed’s rate cut have fueled demand.
Trust with CoinPedia:
CoinPedia has been delivering accurate and timely cryptocurrency and blockchain updates since 2017. All content is created by our expert panel of analysts and journalists, following strict Editorial Guidelines based on E-E-A-T (Experience, Expertise, Authoritativeness, Trustworthiness). Every article is fact-checked against reputable sources to ensure accuracy, transparency, and reliability. Our review policy guarantees unbiased evaluations when recommending exchanges, platforms, or tools. We strive to provide timely updates about everything crypto & blockchain, right from startups to industry majors.
Investment Disclaimer:
All opinions and insights shared represent the author's own views on current market conditions. Please do your own research before making investment decisions. Neither the writer nor the publication assumes responsibility for your financial choices.
Sponsored and Advertisements:
Sponsored content and affiliate links may appear on our site. Advertisements are marked clearly, and our editorial content remains entirely independent from our ad partners.