- Shubham Vishwakarma
 Shubham Vishwakarma
- Feb 20, 2026 12:18 UTC
-
Bitcoin Price Trades Above $68K as Large Holders Step Back In: Is a Structural Break Approaching?
Bitcoin price breaks out of falling channel, while compressing beneath major weekly hurdle at $70k.
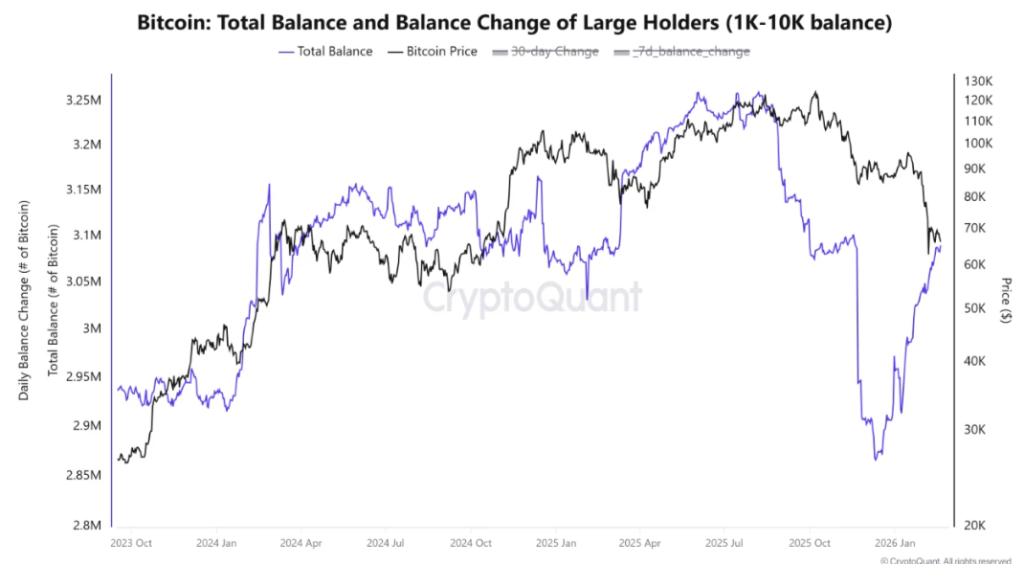
Large holders have accumulated roughly 200,000 BTC in the past 30 days, reversing post-October distribution.
Bitcoin price climbs back above $68,000, registering a 1.8% gain today. On the surface, it appears to be another incremental move inside a broader consolidation range. But beneath the price action, the structural landscape is quietly shifting. After months of measured distribution near prior highs, large holders are rebuilding exposure. On-chain balance data shows that the entire reduction in whale reserves that followed the October peak has now been reversed. This is not random accumulation, it is coordinated absorption into corrective weakness.
The immediate question is no longer whether Bitcoin price can hold $68K. The more important question is whether this reaccumulation phase marks the early foundation of a broader structural breakout.
Whale Accumulation Returns: And It’s Strategic
Wallets holding between 1,000 and 10,000 BTC, typically categorized as institutional-scale participants or deep liquidity entities have added approximately 200,000 BTC in the past month alone. On-chain data illustrate a sharp V-shaped recovery in reserves. The previous drawdown in large-holder balances began shortly after October’s local peak, coinciding with a period of market exhaustion. That distribution phase now appears fully retraced.
This reversal is significant for two reasons.
First, historical patterns show that whale distribution often aligns closely with local tops. Their current behavior, accumulation during price consolidation suggests a shift from defensive positioning to strategic rebuilding.
Second, this flow appears spot-driven rather than leverage-led. Larger transaction sizes dominate recent order flow data, while smaller retail-sized activity remains comparatively muted. Markets driven by spot absorption tend to stabilize before they expand. They build floors before they print headlines. In practical terms, available liquid supply is being quietly reduced. When 200,000 BTC migrates into strong hands within a 30-day window, the market’s sensitivity to incremental demand increases materially.
Bitcoin Price Channel Breakout Signals Momentum Shift
On the 1-hour chart, Bitcoin (BTC) price recently broke out of a well-defined descending channel that capped price action after rejection near $69,800. That falling channel had produced a sequence of lower highs, compressing price toward the $66,800–$67,000 support zone. The breakout above the channel’s upper boundary suggests short-term downside momentum has been neutralized. Technically, this matters because descending channels often represent corrective pauses within broader uptrends. A breakout from such formations frequently signals the beginning of a renewed impulse leg, provided higher timeframe resistance is cleared.
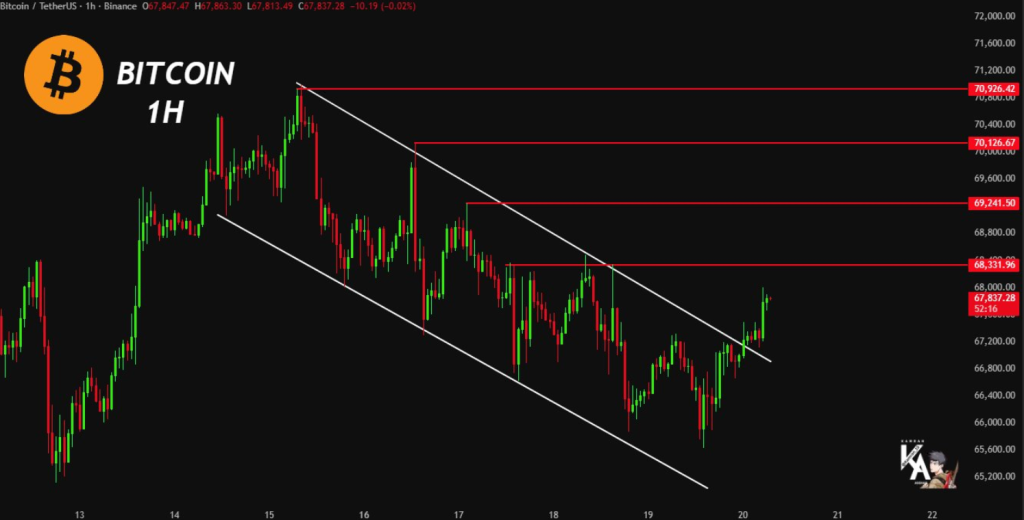
The $69,500-$70,000 remains the first supply cluster from the recent rejection, while $71,200 is the key psychological structural resistance band on both hourly and daily charts. While $67k now acts as the short-term support, aligning with the prior channel base, and $65k-$66k remains the broader weekly higher-low region. Holding above $67k maintains bullish intraday structure.
A confirmed weekly close above $70k would open the path toward the next major supply pocket between $74,000 and $76,000, where historical trading activity suggests liquidity concentrations. Failure to reclaim the $70k mark would likely extend the consolidation phase, but with a progressively strengthening structural base beneath.
Bitcoin Sharpe Ratio Strengthens as Whale Accumulation Builds
Bitcoin’s Sharpe ratio has rebounded from recently compressed levels, suggesting the latest correction functioned as a volatility reset rather than a structural breakdown.
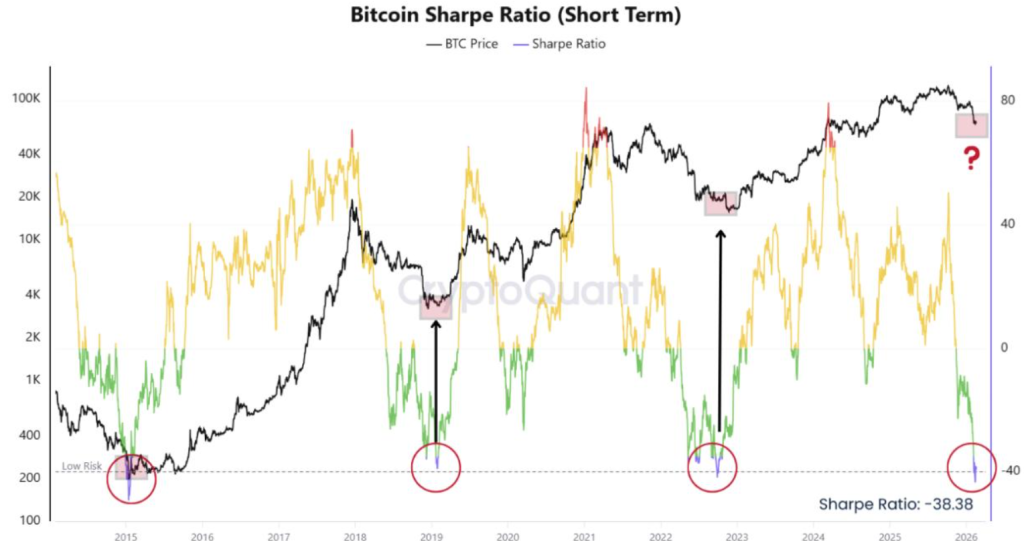
Similar troughs in the past aligned with accumulation phases, not cycle tops. The current improvement in risk-adjusted returns comes alongside controlled funding and steady whale accumulation, indicating normalization rather than speculative excess. In essence, the market appears to be rebuilding risk balance beneath resistance, a healthier backdrop than during the previous advance.
Bitcoin (BTC) Next Move Hinges Here
Bitcoin price holding above $68,000 is not just a technical event, it coincides with roughly 200,000 BTC added to whale wallets over the past month, fully reversing post-October distribution.
As long as price remains supported above the $66,000–$67,000 region, that accumulation continues to underpin structure. The decisive pivot remains $70,000. A confirmed weekly reclaim would align tightening supply with technical breakout conditions, potentially opening the path toward $74,000–$76,000. If resistance holds, consolidation may extend, but with large holders stepping back in, downside pressure appears increasingly absorbed rather than accelerating.
FAQs
Bitcoin is climbing due to strategic whale accumulation, with large holders adding 200,000 BTC in the past month and absorbing selling pressure during the recent correction.
If Bitcoin holds above $67,000 support and reclaims $70,000 with a weekly close, the next target is the $74,000 to $76,000 resistance zone.
The immediate resistance cluster is $69,500 to $70,000. A breakout above this level with strong volume could trigger momentum toward $74,000.
Trust with CoinPedia:
CoinPedia has been delivering accurate and timely cryptocurrency and blockchain updates since 2017. All content is created by our expert panel of analysts and journalists, following strict Editorial Guidelines based on E-E-A-T (Experience, Expertise, Authoritativeness, Trustworthiness). Every article is fact-checked against reputable sources to ensure accuracy, transparency, and reliability. Our review policy guarantees unbiased evaluations when recommending exchanges, platforms, or tools. We strive to provide timely updates about everything crypto & blockchain, right from startups to industry majors.
Investment Disclaimer:
All opinions and insights shared represent the author's own views on current market conditions. Please do your own research before making investment decisions. Neither the writer nor the publication assumes responsibility for your financial choices.
Sponsored and Advertisements:
Sponsored content and affiliate links may appear on our site. Advertisements are marked clearly, and our editorial content remains entirely independent from our ad partners.