- Shayan Chowdhury
 Shayan Chowdhury
Shayan is a digital nomad and a professional journalist. He delivers high-quality engaging articles to Coinpedia through his in-depth research and analysis.
- Jul 29, 2025 17:47 UTC
-
Bitcoin Faces Resistance at $119K as 613K BTC Threatens Selloff: What’s Next for BTC Price?

Bitcoin’s upward momentum could face a major hurdle as over 613,000 BTC—worth billions—loom over the market, posing a significant selloff risk. With Bitcoin eyeing the critical $119K resistance level, traders and investors are moving cautiously. This potential influx of supply could stall or even reverse the current bullish trend, raising concerns about near-term volatility.
Profit-Taking Sparks Volatility Threat for Bitcoin
In the past 24 hours, Bitcoin’s price has been very unstable, with sellers pushing hard to keep it below $119,000. This led to a large wave of forced selling, according to data from Coinglass. In total, more than $55 million in positions were liquidated, with over $41 million of that coming from buyers who had bet that Bitcoin’s price would go up.
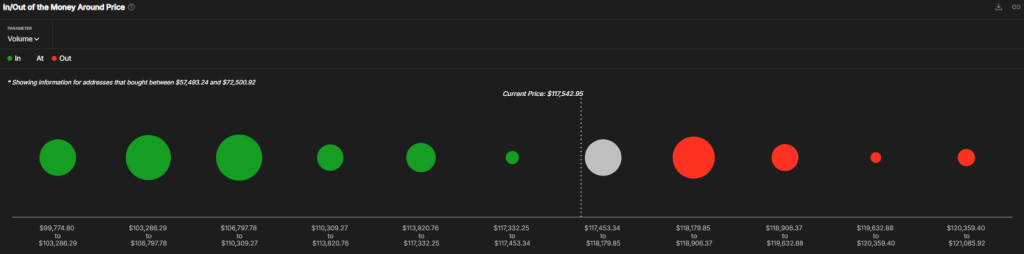
Data from IntoTheBlock shows that many investors bought Bitcoin around the $118,573 level, with about 613,200 BTC held at that average price. Since the current price is below that, these holders are sitting on losses. If Bitcoin tries to climb back above $119,000, many of these investors might sell to cut their losses, creating more selling pressure. This could make it harder for the price to recover in the short term.
Bitcoin’s recent surge to new highs has led to a noticeable change in how investors are behaving. Long-term holders, who usually keep their Bitcoin for more than 155 days, are starting to sell, which could signal a turning point in the market.
According to on-chain data, these long-term holders have sold around 52,000 BTC since Bitcoin hit its latest high. On July 29, analyst Axel Adler Jr. pointed out on X that this sell-off happened around the $118,000 mark, showing a clear shift from holding to selling, similar to past market cycles.
Also read: Is Galaxy Digital Selling Again? On-Chain Signals Hint at a Bitcoin Turning Point
If Bitcoin manages to break above its current price range, it could regain momentum and push to new highs. But if it falls below key support levels, it might lead to a steeper drop.
What’s Next for BTC Price?
Bitcoin dipped below the 20-day moving average, but the long lower shadow on the candlestick suggests buyers stepped in at lower prices. As of writing, BTC price trades at $117,993, declining over 0.3% in the last 24 hours.
Right now, the bulls are trying to push the BTC/USDT pair above a key resistance zone between $119,119 and $120,220. If they succeed, the price could gain momentum and rise toward $123K, with a potential target of $135,000 based on the current chart pattern.
To turn things around, sellers would need to defend $119K and drag the price below the $115K support level. If that happens, it could catch overconfident buyers off guard and potentially send Bitcoin down to the psychological support level at $110,000.
Trust with CoinPedia:
CoinPedia has been delivering accurate and timely cryptocurrency and blockchain updates since 2017. All content is created by our expert panel of analysts and journalists, following strict Editorial Guidelines based on E-E-A-T (Experience, Expertise, Authoritativeness, Trustworthiness). Every article is fact-checked against reputable sources to ensure accuracy, transparency, and reliability. Our review policy guarantees unbiased evaluations when recommending exchanges, platforms, or tools. We strive to provide timely updates about everything crypto & blockchain, right from startups to industry majors.
Investment Disclaimer:
All opinions and insights shared represent the author's own views on current market conditions. Please do your own research before making investment decisions. Neither the writer nor the publication assumes responsibility for your financial choices.
Sponsored and Advertisements:
Sponsored content and affiliate links may appear on our site. Advertisements are marked clearly, and our editorial content remains entirely independent from our ad partners.