Qadir AK

Qadir AK

Author
Qadir Ak is the founder of Coinpedia. He has over a decade of experience writing about technology and has been covering the blockchain and cryptocurrency space since 2010. He has also interviewed a few prominent experts within the cryptocurrency space.
Reviewed by:

Mustafa Mulla

Reviewed
Mustafa has been writing about Blockchain and crypto since many years. He has previous trading experience and has been working in the Fintech industry since 2017.
- Nov 10, 2023 05:18 UTC
QStick Demystified: The Ultimate Momentum Indicator for Crypto Traders
There are certain indicators that can provide amazingly accurate insights, especially when it comes to analysing trends. One such indicator is QStick. There are several specialities with this indicator that help it stand out from other trend-focused indicators. Here, the attempt is to explain this indicator in the simplest way possible to make it easy for even beginner traders to use it easily. Let’s start!
1. What’s QStick Indicator
The QStick Indicator, created by Tusher Chande, is an advanced technical momentum indicator. It gives traders insights into whether an asset is generally moving up or down based on its daily price change, by examining the moving average of the difference between the closing and opening prices.
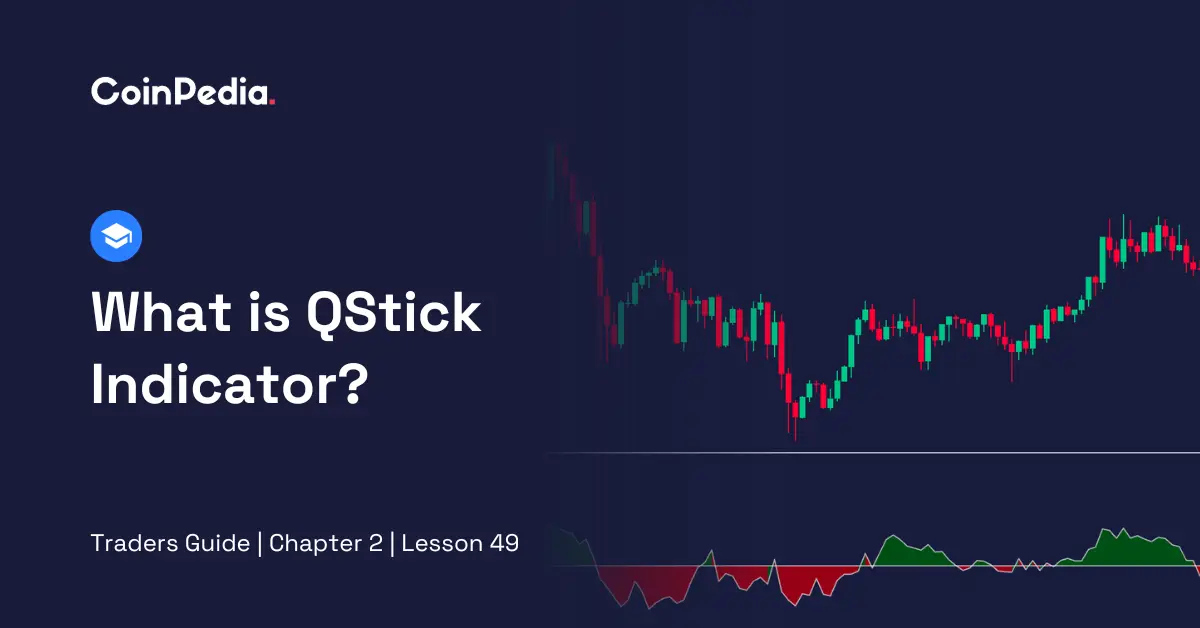
1.1. How Does QStick Appears
The QStick indicator is an oscillator. It appears as a line on a chart that moves above or below a central zero line. In TradingView, it appears below the price chart.
2. Simple Way to Calculate QStick Explained
Calculating QStick is simple. Let’s learn the formula first.
| QStick = MA (Close – Open, n) |
The QStick indicator is calculated using a moving average (MA) of the difference between the closing and opening price over a specified period (n).
Let’s break down the calculation to learn it further.
- Subtract the opening price from the closing price for each period.
- Calculate the moving average of these differences over the chosen time frame and length.
3. Launching QStick on a TradingView Chart: Step-By-Step Guide
Here is the step-by-step to launch QStick on a TradingView chart:
- Log in to your TradingView account
- Choose the financial instrument or asset you want to analyse
- Find and click on the ‘Indicators’ tab at the top of the chart
- In the search bar, type ‘QStick’ to locate the indicator
- Click on QStick to add it to your chart
- Customise the QStick settings, including time frame, moving average length and type
- Click ‘OK’
- Analyse the QStick line on your chart
4. How to Interpret QStick: The Basics You Should Know
Here are the three basic signals that this indicator generally gives.
- Zero Line Crossing
Crossing above zero signals a potential buy, and crossing below zero signals a potential sell. The former is a bullish indication and the latter one is bearish.
- Extreme Highs & Lows
Look for extremes in QStick values. Reversing off an extreme high signals a potential Sell, while reversing off an extreme low signals a potential buy.
- Divergence
Compare QStick with the asset price. If a QStick is up but the asset price is down, it is a potential buy. If QStick is down but the asset price is up, it is a potential sell.
Endnote
The QStick indicator, devised by Tusher Chande, is a valuable tool for traders, providing insights into asset momentum. Calculated as the moving average of closing-open price differences, it appears as an oscillator on charts. To apply it on TradingView, users can follow a simple step-by-step guide. Interpretation involves signals from zero line crossings, extreme highs and lows and divergences with asset prices. This indicator aids traders in making informed decisions by discerning potential buying or selling opportunities based on market trends and extremes
Well Done! You have now completed the Lesson.
Complete the Quiz and Get Certified! All The Best!
We'd Love to Hear Your Thoughts on This Article!
Was this writing helpful?
 Yes No
Disclaimer and Risk Warning
The information provided in this content by Coinpedia Academy is for general knowledge and educational purpose only. It is not financial, professional or legal advice, and does not endorse any specific product or service. The organization is not responsible for any losses you may experience. And, Creators own the copyright for images and videos used. If you find any of the contents published inappropriate, please feel free to inform us.


