Qadir AK

Qadir AK

Author
Qadir Ak is the founder of Coinpedia. He has over a decade of experience writing about technology and has been covering the blockchain and cryptocurrency space since 2010. He has also interviewed a few prominent experts within the cryptocurrency space.
Reviewed by:

Mustafa Mulla

Reviewed
Mustafa has been writing about Blockchain and crypto since many years. He has previous trading experience and has been working in the Fintech industry since 2017.
- Sep 12, 2023 05:47 UTC
What Is ADX? A Simple Guide to Trading with the Average Directional Index
Ever found yourself wondering if a trend will continue or just fade away? You’re not alone. Many traders struggle with this exact problem. Enter the Average Directional Index (ADX) – a tool that helps you measure the strength of a trend.
If you’ve ever been caught in a false breakout or entered a trade only to see the trend lose steam, ADX might just be the missing piece in your trading strategy. Let’s break it down in simple terms.
What Is Average Directional Index (ADX)?
The Average Directional Index (ADX) is a technical indicator that measures the strength of a trend. It doesn’t tell you whether the price will go up or down, but it does tell you how strong a trend is. And that’s valuable information.
Imagine you’re surfing. The bigger the wave, the longer and smoother your ride. But if the wave is weak, you’ll struggle to stay on your board. ADX does the same for traders – it helps you catch strong trends and avoid weak ones.
ADX values range from 0 to 100. Here’s a simple breakdown:
- Below 20 – Weak or no trend
- 20-40 – Moderate trend
- 40-60 – Strong trend
- Above 60 – Very strong trend
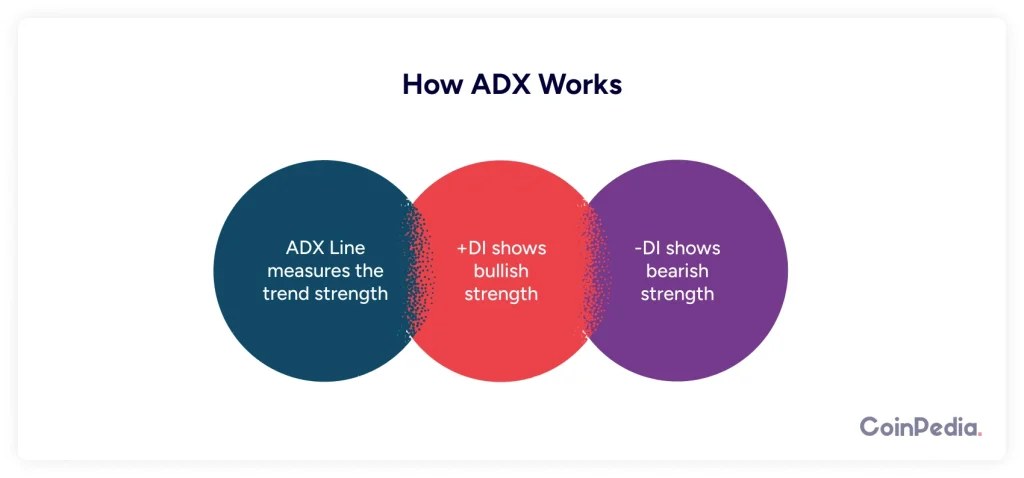
How ADX Works
ADX doesn’t work alone. It’s actually a combination of three lines:
- ADX Line – Measures the trend strength.
- +DI (Positive Directional Indicator) – Shows bullish strength.
- -DI (Negative Directional Indicator) – Shows bearish strength.
When the +DI is above the -DI, it means bulls are in control. When the -DI is above the +DI, bears are dominating. The ADX line, meanwhile, tells you how strong this battle is.Think of it like a tug-of-war match. The DI lines show which team is pulling harder, while the ADX line shows how intense the match is.
How to Calculate the ADX?
You don’t actually need to calculate ADX manually since most trading platforms do it for you. But understanding how it works can help you trust the numbers. Here’s how it’s done:
- Calculate the +DI and -DI
- Find the difference between today’s high and yesterday’s high (+DM)
- Find the difference between yesterday’s low and today’s low (-DM)
- If +DM is higher, use it; if -DM is higher, use that instead
- Smooth these values over a set period (usually 14 days)
- Calculate the ADX Line
- Take the absolute difference between +DI and -DI
- Divide it by the sum of +DI and -DI
- Multiply by 100
- Smooth this value over 14 periods
This might sound complex, but platforms like TradingView, MetaTrader, and ThinkorSwim plot it automatically, so you just need to focus on interpreting the values.
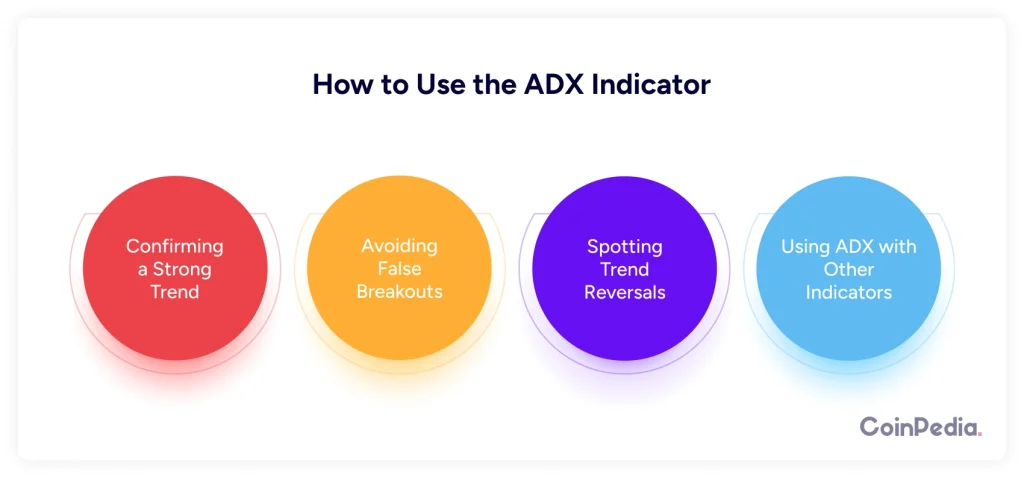
How to Use the ADX Indicator
Now that you know what ADX is, how do you actually use it in trading? Here are some ways:
1. Confirming a Strong Trend
If ADX is above 25, the trend is strong. If it’s below 20, the trend is weak or non-existent.
Example: Let’s say Bitcoin is trending upwards. The ADX is at 35, confirming strong momentum. This gives you more confidence to buy rather than short the market.
2. Avoiding False Breakouts
A breakout means nothing if there’s no strength behind it. Before entering a breakout trade, check if ADX is rising above 25. If it’s below 20, the breakout might fail.
Example: A stock jumps 5% in one day, but ADX is at 15. This signals a fake breakout – better to wait.
3. Spotting Trend Reversals
If ADX is declining, it means the trend is losing strength. This could signal a reversal or a period of sideways movement.
Example: You see the ADX dropping from 40 to 20. This means the strong trend is fading, and you might consider taking profits.
4. Using ADX with Other Indicators
ADX works best when combined with other indicators:
- Moving Averages – To confirm trends
- RSI (Relative Strength Index) – To check overbought/oversold conditions
MACD (Moving Average Convergence Divergence) – To confirm momentum
Advantages and Disadvantages of ADX
Advantages
- Helps filter out weak trends – No more wasting time on weak trends.
- Works in all markets – Stocks, forex, crypto – you name it.
- Easy to interpret – Just follow the 0-100 scale.
- Reduces false signals – Helps you avoid getting trapped in bad trades.
Disadvantages
- Doesn’t predict direction – You still need other tools to determine if a trend is up or down.
- Lagging indicator – ADX reacts after the trend is already in motion.
- Can be slow in fast markets – In crypto and forex, price moves quickly, and ADX might not catch up in time.
Final Thoughts: Is ADX Right for You?
ADX is a powerful tool for trend traders. It helps you focus on strong trends and avoid weak or choppy markets. However, it’s not a magic bullet – always use it alongside other indicators for the best results.
If you’re someone who struggles with knowing whether a trend will continue, ADX can give you that extra confirmation. So, next time you’re about to enter a trade, take a quick look at ADX. It might just save you from a bad decision!
FAQs
Yes, but it works best for swing and trend trading. For short-term trades, combine ADX with faster indicators like RSI or MACD.
It depends on your strategy. For short-term traders, the 5- to 15-minute charts work well. For swing traders, daily or 4-hour charts are ideal.
No, ADX is designed to measure trend strength. In a sideways market, ADX will remain low, making it less useful.
They serve different purposes. ADX measures trend strength, while moving averages help identify trend direction. Using them together can be more effective.
A falling ADX below 20 suggests a weak trend, which may lead to a reversal or sideways movement.
Well Done! You have now completed the Lesson.
Complete the Quiz and Get Certified! All The Best!
We'd Love to Hear Your Thoughts on This Article!
Was this writing helpful?
 Yes No
Disclaimer and Risk Warning
The information provided in this content by Coinpedia Academy is for general knowledge and educational purpose only. It is not financial, professional or legal advice, and does not endorse any specific product or service. The organization is not responsible for any losses you may experience. And, Creators own the copyright for images and videos used. If you find any of the contents published inappropriate, please feel free to inform us.


