Chandan Gupta

Chandan Gupta

Author
- Mar 14, 2025 04:55 UTC
-
Cardano (ADA) Price Prediction for March 14

ADA, the native token of the Cardano blockchain, seems to be facing strong resistance from the 200 Exponential Moving Average (EMA) on the daily timeframe, near the $0.75 mark. The daily chart shows that ADA has been facing this resistance for the last four consecutive days and is struggling to breach the 200 EMA.
Current Price Momentum
At press time, ADA is trading near $0.70, having registered a 3% price drop in the past 24 hours. However, during the same period, its trading volume declined by 10%, indicating reduced participation from traders and investors compared to the previous day.
Cardano (ADA) Technical Analysis and Upcoming Levels
According to expert technical analysis, ADA is currently near a crucial support zone at $0.68 and $0.65, while $0.75 is acts as a strong resistance level, potentially hindering further rally attempts.
Based on recent price action and historical patterns, if ADA breaches the 200 EMA and closes a daily candle above the $0.75 level, there is a strong possibility it could soar by 50% to reach the $1.13 mark. To achieve this target, ADA must first surpass a mild resistance level at $0.85.
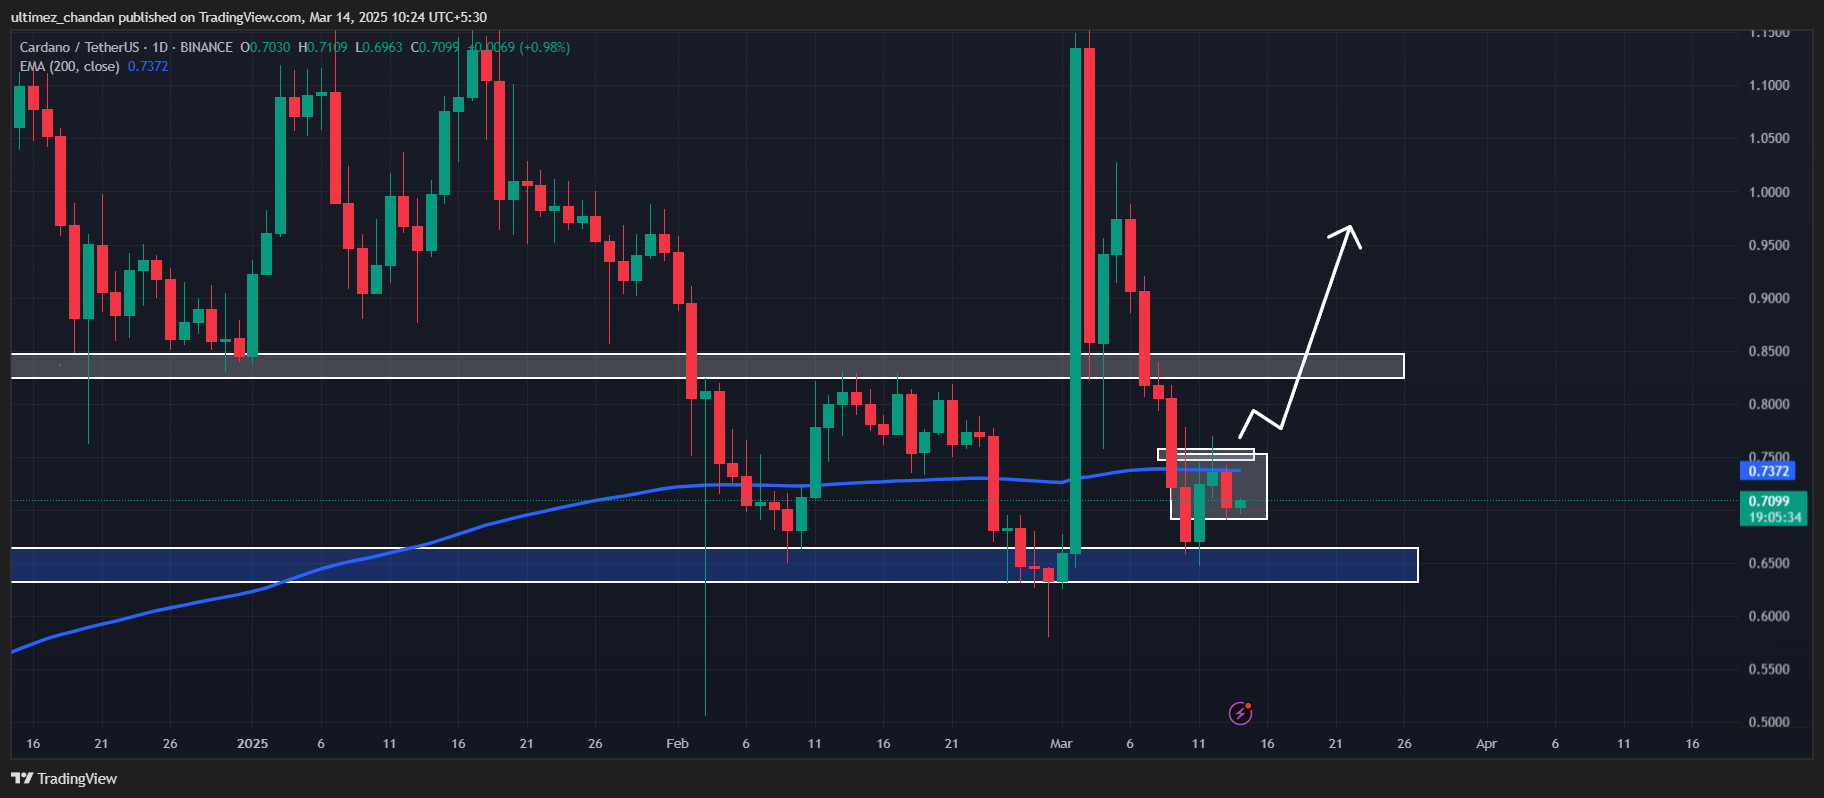
On the other hand, if the asset falls below the $0.68 level, it could decline by 10% to reach $0.62 in the coming days.
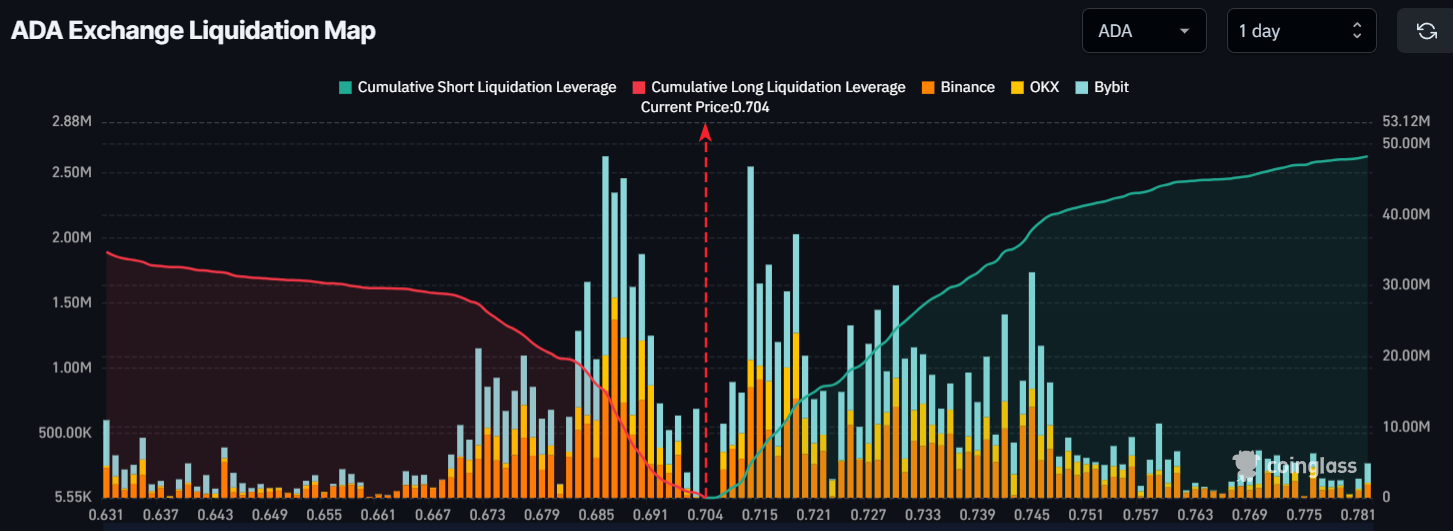
Traders’ $15 Million Worth Bait on the Long Side
Despite the mixed sentiment, traders appear bullish on the asset as they are betting on the long side. Data from Coinglass reveals that traders have over-leveraged at $0.685 on the lower side, with $15 million worth of long positions. Meanwhile, $0.714 is another over-leveraged level, where traders have built $5 million worth of short positions.
When combining these on-chain metrics with technical analysis, it appears that bulls are currently dominating the asset and could potentially breach this ongoing hurdle.