Mustafa Mulla

Mustafa Mulla

Author
Mustafa has been writing about Blockchain and crypto since many years. He has previous trading experience and has been working in the Fintech industry since 2017.
- Mar 07, 2025 12:56 UTC
-
XRP, SUI, and HBAR Price Analysis: Key Levels to Watch This Week

XRP experienced a price recovery followed by a correction, facing resistance around $2.64.
SUI saw a significant price surge driven by partnerships and ETF news, but it's still struggling to break above the $3 mark.
HBAR is in a bullish phase, with its price supported by EMA structures and a potential breakout from a symmetrical triangle pattern.
Like Bitcoin and Ethereum, XRP started a recovery from the $2.20 level, moving past the $2.55 resistance. However, strong selling pressure at $2.64 caused a pullback, bringing the price back below $2.54.
On the XRP/USD hourly chart, the price dropped below a key trend line that had support at $2.55. It also slipped under the 50% Fibonacci retracement level of its recent rise from $2.211 to $2.6390.
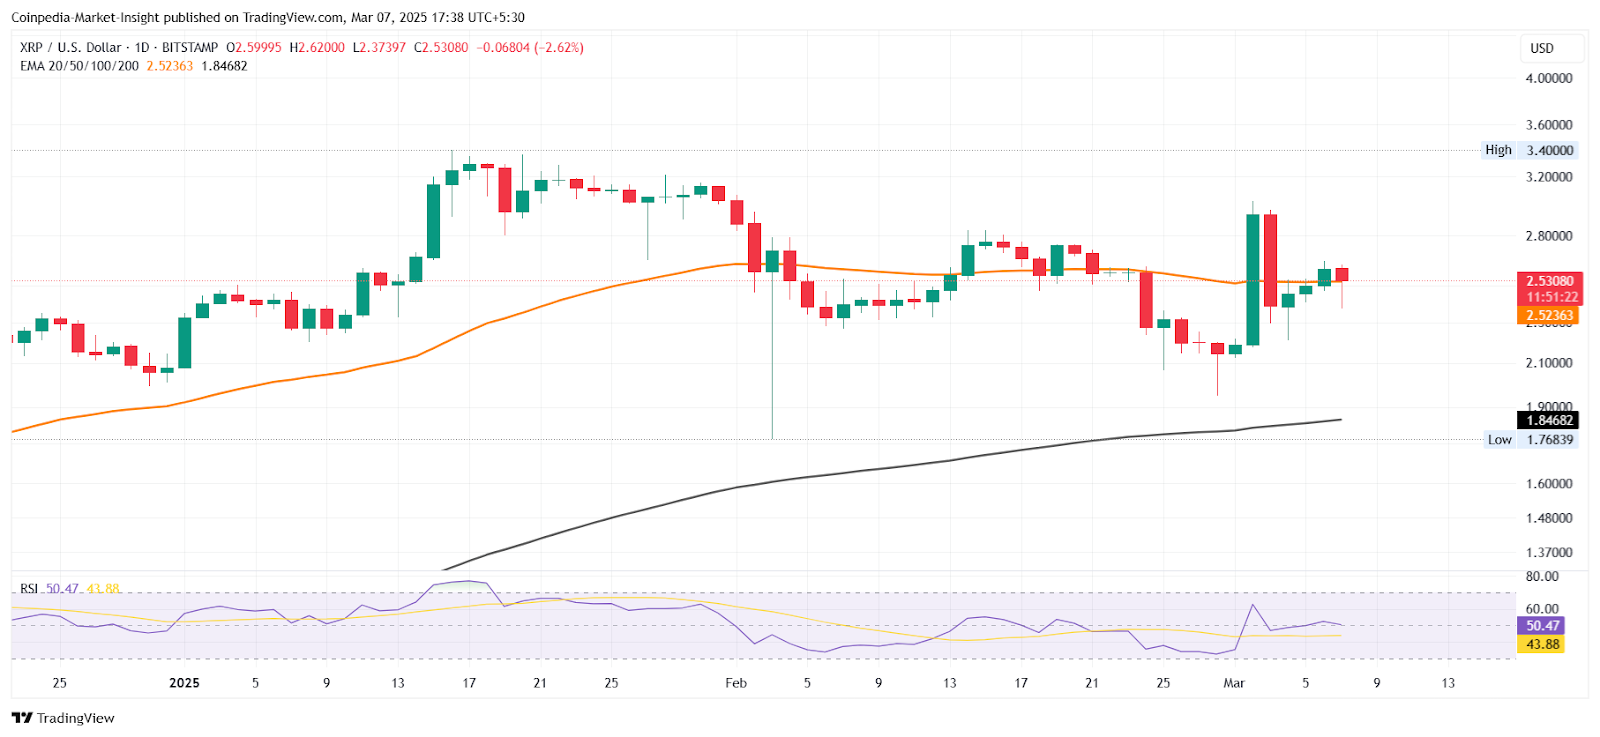
Key Levels to Watch
- Resistance: The first major hurdle is $2.5702, followed by $2.64. If XRP breaks past this, it could reach $2.72, with potential for further gains toward $2.80–$2.85. A strong rally could even push it to $3.00.
- Support: If XRP fails to break $2.5702, it might decline again. The first key support is at $2.4250, followed by $2.3750, which aligns with the 61.8% Fibonacci retracement level from $2.211 to $2.6390.
SUI Trading Volume Surpasses $20B, SUI to Break $3?
The SUI coin defies market slump, surging 7%, from $2.6845 to $2.97 on Friday after Sui coin trading volume surged past $20 billion, signaling a potential shift in market dynamics. SUI price hike is also fueled by a strategic partnership with Trump-linked DeFi protocol World Liberty Financial (WLFI) and news that Canary Capital filed to establish a trust entity in Delaware for its proposed Canary SUI ETF.
On the technical side, SUI continues to trade below the $3 mark, struggling to gain momentum. At 59.97, the relative strength indicator(RSI) suggests that the asset is not oversold but remains in neutral territory.
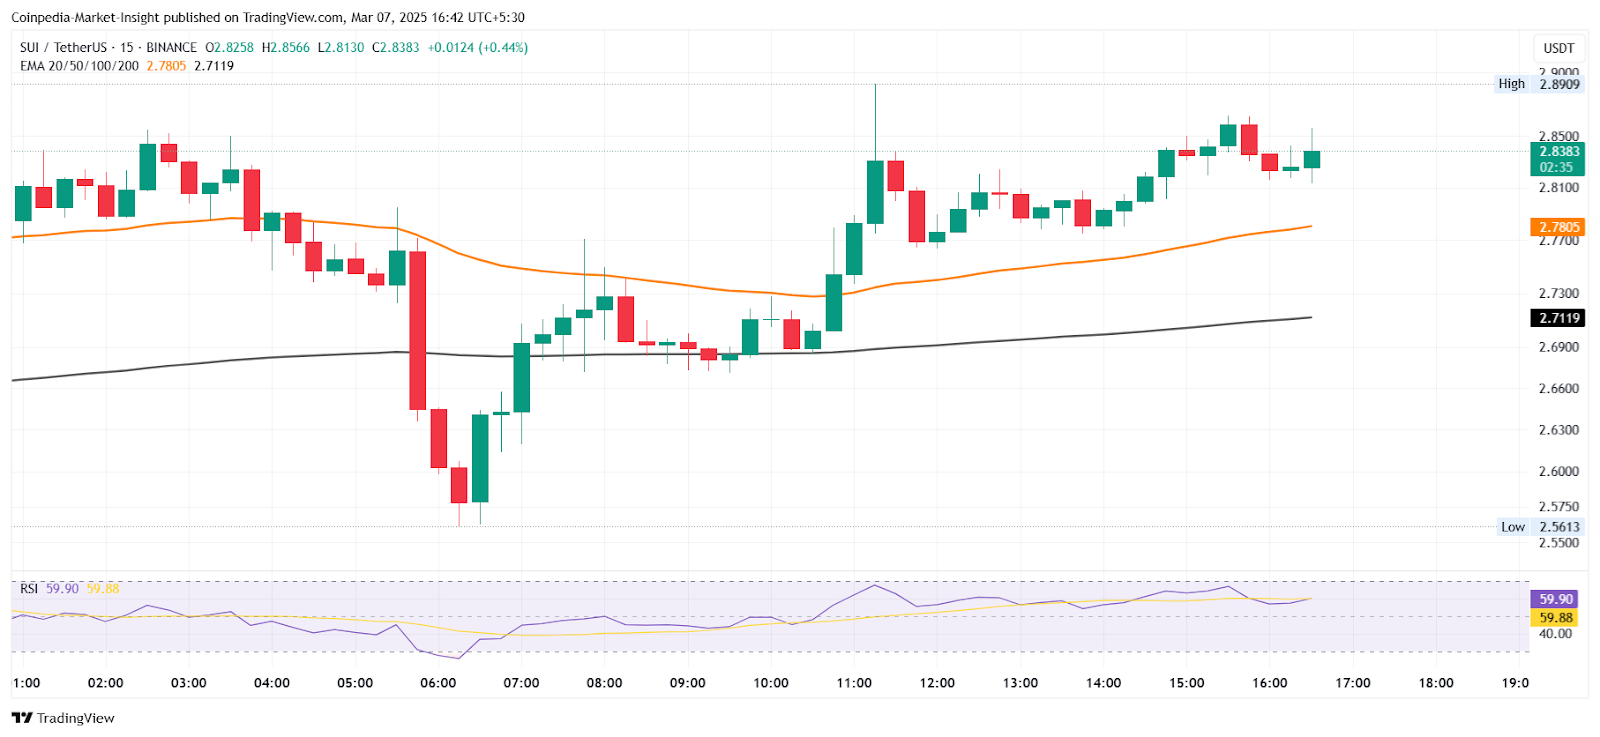
The 50-day EMA, $3.35, and the 200-day EMA, $3.02, both indicate a bearish trend. If selling pressure increases, support is found between $2.70 and $2.50, with resistance at $3.57.
Meanwhile, a 14.53% increase in open interest ($664 million) over the past 24 hours, indicating growing market activity. Although a breakthrough above $3 could boost momentum, a longer-term recovery will require higher demand and better-decentralized finance activity.
Hedera’s HBAR Set For $0.33?
HBAR’s price has soared by more than 1% in the last 24 hours, and it is now trading at $0.25. Furthermore, Coinpedia reports that Hedera has increased by up to 32% over the last seven days.
HBAR/USDT is now in a bullish phase, supported by the EMA structure. The (20, 50, 100, 200)-day Exponential Moving Averages (EMAs) show the 20 EMA passing above the 50 EMA, indicating bullish momentum. The 200 EMA is currently performing as a dynamic support level at 0.24414 USDT.
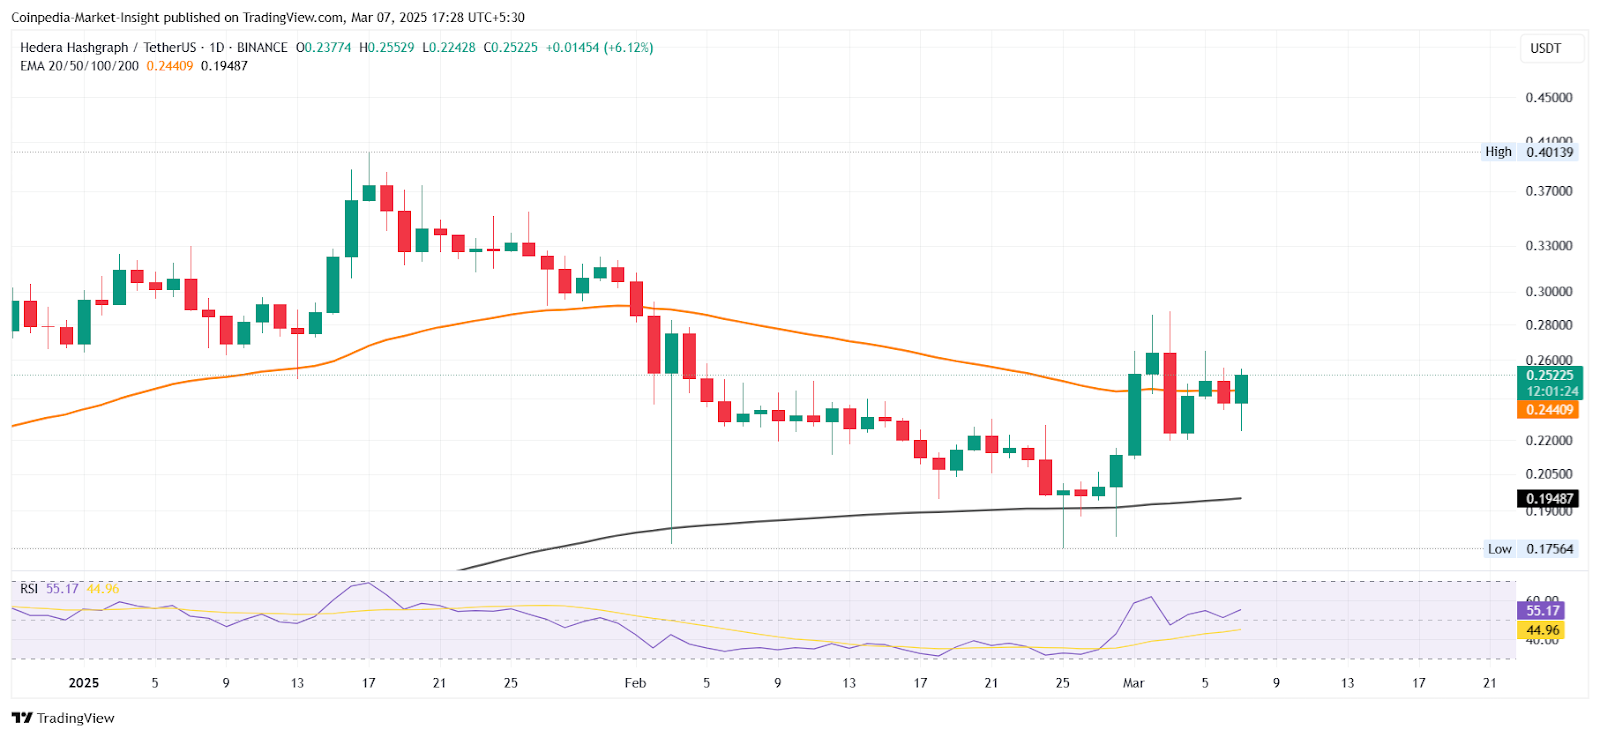
This symmetrical triangular pattern on the hourly HBAR price charts, shown by yellow solid lines, is centered around the trend line of $0.255. If the positive momentum continues, the immediate resistance is $2.88. A breakout might take the price above $0.3306.