Say you open your crypto trading app. The charts are moving. Numbers are flashing. Prices are jumping up and down. How do you know when to buy? When to sell? When to just sit tight?
That’s where trading indicators come in. They help traders make sense of all the madness. If you’re new to crypto, understanding indicators is like having a map in a foreign city. Without it, you might get lost. With it, you can navigate the market with confidence.
In this guide, we’ll break down the most useful trading indicators, how to use them, and how to combine them for better results.
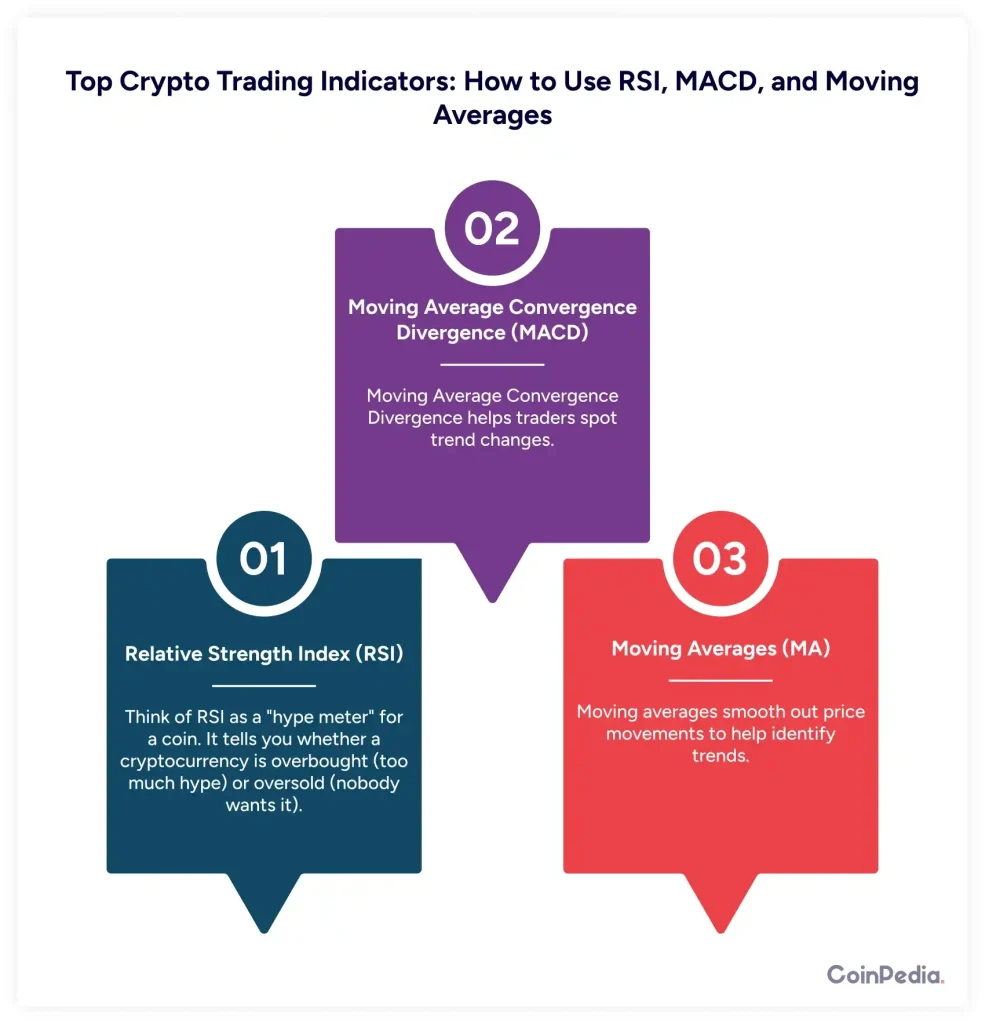
Top Crypto Trading Indicators: How to Use RSI, MACD, and Moving Averages
There are dozens of indicators out there, but let’s start with three of the most popular ones:
1. Relative Strength Index (RSI)
Think of RSI as a “hype meter” for a coin. It tells you whether a cryptocurrency is overbought (too much hype) or oversold (nobody wants it).
- If RSI is above 70, the asset is overbought – meaning it might be time to sell.
- If RSI is below 30, the asset is oversold – meaning it could be a good buying opportunity.
Example: Bitcoin’s RSI hits 80. This means too many people have bought it recently. A price drop might be coming. A smart trader could wait for the RSI to cool off before buying.
2. Moving Average Convergence Divergence (MACD)
MACD helps traders spot trend changes. It consists of two lines:
- A fast-moving line (short-term trend)
- A slow-moving line (long-term trend)
When the fast-moving line crosses above the slow-moving line, it signals a buy opportunity. When it crosses below, it signals a sell.
Example: The MACD line crosses above the signal line. This could mean an uptrend is starting. A trader might decide to buy before the price climbs further.
3. Moving Averages (MA)
Moving averages smooth out price movements to help identify trends.
- Simple Moving Average (SMA): An average of past prices over a set period.
- Exponential Moving Average (EMA): Similar to SMA but gives more weight to recent prices.

Example: If Bitcoin’s price is above its 50-day moving average, it suggests an uptrend. If it drops below, it might signal a downtrend.
Best Technical Indicators for Crypto Trading: Trends, Momentum & Volume Signals
Besides RSI, MACD, and MAs, here are a few more indicators that can improve your trading decisions:
1. Bollinger Bands
Bollinger Bands measure price volatility. They consist of three lines:
- A middle line (moving average)
- An upper band (high price range)
- A lower band (low price range)
When the price touches the upper band, the asset might be overbought. When it touches the lower band, it might be oversold.
Example: Ethereum’s price touches the lower Bollinger Band. This might be a signal to buy as a price bounce could be coming.
2. Volume Indicators (OBV – On Balance Volume)
Volume indicators tell you whether the market is truly interested in a coin.
- If the price is going up with high volume, it confirms a strong uptrend.
- If the price is going down with high volume, it signals a strong downtrend.
Example: A coin’s price rises, but the volume is low. This could mean a weak uptrend and a possible fakeout.
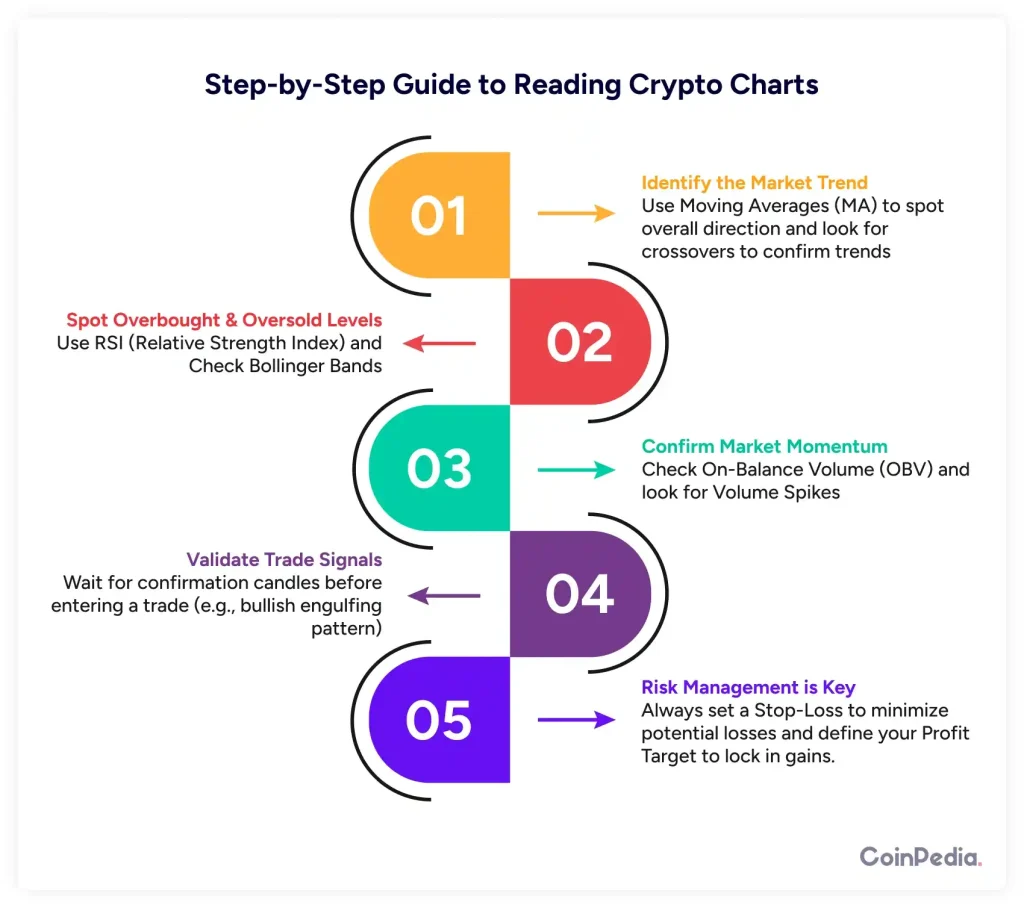
Step by Step: How to Read Crypto Charts for Profitable Trades
Now that you know some indicators, let’s put them together in a simple strategy:
Step 1: Identify the Trend
Use Moving Averages and MACD to see if the market is trending up or down.
Step 2: Look for Overbought or Oversold Conditions
Check RSI and Bollinger Bands to see if the asset is overpriced or underpriced.
Step 3: Confirm with Volume
Look at On-Balance Volume (OBV) to check if traders are actually buying or selling.
Step 4: Enter the Trade
If all signals align (e.g., RSI is low, MACD shows a buy signal, and volume is rising), consider entering a trade.
Step 5: Set Stop-Loss and Take-Profit Levels
Always set a stop-loss to protect yourself from unexpected moves.

Combining Crypto Indicators for a Winning Trading Strategy
No single indicator works 100% of the time. The best traders combine multiple indicators for a more complete picture.
Example of a Trading Strategy:
- Use the 50-day Moving Average to identify the trend.
- Use RSI to check if the asset is overbought or oversold.
- Confirm with MACD for buy or sell signals.
- Check volume to confirm the trend.
If all indicators point in the same direction, the trade has a higher probability of success.
Final Thoughts: Mastering Crypto Trading Indicators
Trading isn’t just about gut feelings. It’s about making informed decisions. Crypto indicators are tools that help you see beyond the noise of price fluctuations.
- Start with simple indicators like RSI, MACD, and Moving Averages.
- Learn to combine multiple indicators for better accuracy.
- Always confirm trends with volume before making a move.
The more you practice, the better you’ll get at reading the market.
FAQ
RSI is a great starting point. It helps identify overbought or oversold conditions, making it easier to spot potential buying or selling opportunities.
When the MACD line crosses above the signal line, it suggests a buy signal. When it crosses below, it signals a potential sell opportunity.
Yes, moving averages help identify trends. If the price is above the 50-day MA, it’s an uptrend; below it, a downtrend may be forming.
Bollinger Bands measure volatility. When the price touches the lower band, it may be undervalued; when it touches the upper band, it may be overbought.
Yes, using RSI, MACD, and volume together improves accuracy. No single indicator is foolproof, so combining them enhances decision-making.
Well Done! You have now completed the Lesson.
Complete the Quiz and Get Certified! All The Best!
We'd Love to Hear Your Thoughts on This Article!
Was this writing helpful?
 Yes
Yes  No
No
Disclaimer and Risk Warning
The information provided in this content by Coinpedia Academy is for general knowledge and educational purpose only. It is not financial, professional or legal advice, and does not endorse any specific product or service. The organization is not responsible for any losses you may experience. And, Creators own the copyright for images and videos used. If you find any of the contents published inappropriate, please feel free to inform us.


