



 Advertise



Bitcoin Whales Defy Volatility, Quietly Accumulate BTC at 17% Discount




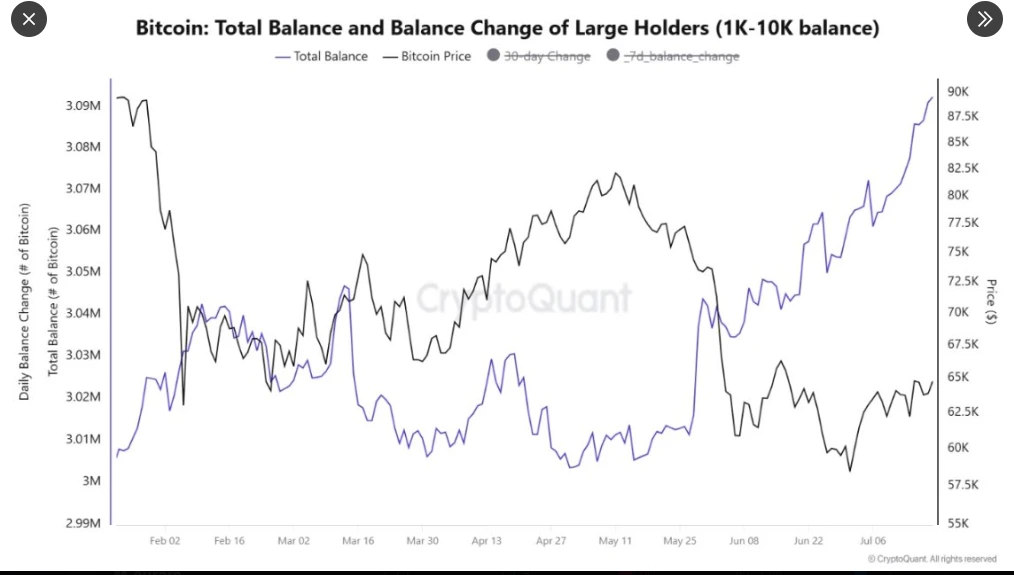
Bitcoin whales have been steadily and quietly accumulating since late May, bringing their total stash to 3.09 million.
This trend has persisted despite price volatility caused by macroeconomic and geopolitical reasons.
One technical trifecta shows BTC may have reached the accumulation zone with the best risk-to-reward ratio.
Bitcoin (BTC) whales (accounts holding between 1,000 and 10,000 BTC) have been consistently accumulating the cryptocurrency since late May. This period of accumulation began in early May, when prices were around $80,000, and has continued even as prices declined 17.25% to a current $66,256.
Whales load up on Bitcoin despite market swings
Unlike previous months, the period since May shows unprecedented, continuous accumulation despite geopolitical and macroeconomic headwinds. In the last month alone, this cohort has accumulated 48,000 Bitcoins. This brings their total stash to 3.09 million Bitcoins, similar to the amount they held in February of this year.
Source: Crypto Quant
These whales likely represent institutions that thrive on Dollar-Cost Averaging (DCA) rather than timing markets for ripe entry levels.

Even then, these whales are likely anticipating a major market turnaround following recent developments in global crypto regulation and technical setups.
US President Donald Trump recently signed an ethics package barring him and any other high-ranking officials from profiting off the crypto policies they shape. Despite this development, nations such as Japan and Russia are way ahead of America in terms of crypto regulation. This builds pressure for swift policy legalization, seeing as the US aims to lead the crypto industry on a global scale.
Technical setups
On-chain metrics such as MVRV (Market Value to Realized Value) and CVDD (Cumulative Value-Days Destroyed) suggest a potential cycle bottom between $40,000 and $50,000.
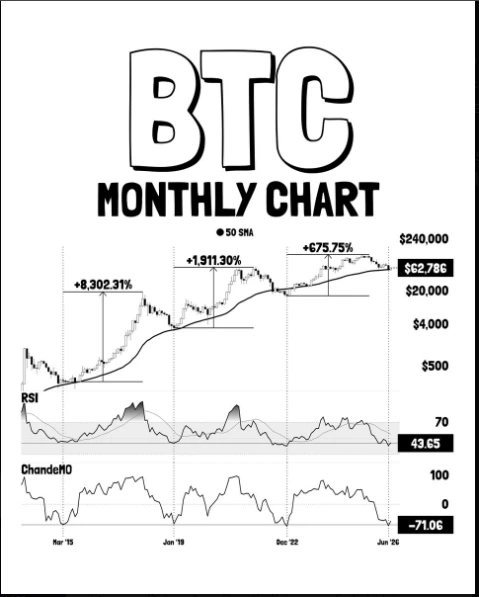
However, one technical trifecta indicates we may have arrived at a historically dominant accumulation zone.
Source: Ali Charts
The monthly Relative Strength Index (RSI) is below 43.65, the Chande Momentum Oscillator is at -71, and BTC is actively trading around its 50-month moving average. The combination of these offers a highly favorable risk-to-reward ratio, driving whale attention away from shorting and into accumulation.
Was this writing helpful?

Trust with CoinPedia:
CoinPedia has been delivering accurate and timely cryptocurrency and blockchain updates since 2017. All content is created by our expert panel of analysts and journalists, following strict Editorial Guidelines based on E-E-A-T (Experience, Expertise, Authoritativeness, Trustworthiness). Every article is fact-checked against reputable sources to ensure accuracy, transparency, and reliability. Our review policy guarantees unbiased evaluations when recommending exchanges, platforms, or tools. We strive to provide timely updates about everything crypto & blockchain, right from startups to industry majors.
Investment Disclaimer:
All opinions and insights shared represent the author's own views on current market conditions. Please do your own research before making investment decisions. Neither the writer nor the publication assumes responsibility for your financial choices.
Sponsored and Advertisements:
Sponsored content and affiliate links may appear on our site. Advertisements are marked clearly, and our editorial content remains entirely independent from our ad partners.