- Steve Muchoki
 Steve Muchoki
- Mar 30, 2026 21:27 UTC
-
Bitcoin Touches $66K as Bearish Signals Flash Warning Signs

BTC has been consolidating between $68K and $66K over the weekend amid market uncertainty.
Several indicators predict an upcoming bear reversal, with support from recent institutional flows.
History points to an inevitable bear-to-bull yield, with buy opportunities flashing before then.
Bitcoin (BTC) has been consolidating between $68,000 and $66,000 over the weekend after falling below $70K last Thursday. At press time, Bitcoin was trading at $66,386, up just 0.02% over the past 24 hours and down 6.27% over the past week. Several indicators signal the coin’s upcoming capitulation but also point to an eventual recovery and a final turn to bullish trends.
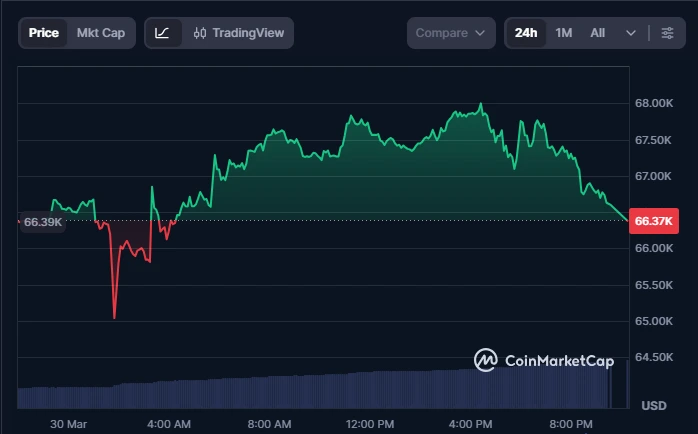
Source: CoinMarketCap
Bitcoin bear momentum indicators
BTC whale and institutional offloading have increased amid prevailing geopolitical and economic stress.
US President Donald Trump claims an ongoing negotiation with Iran to end all hostilities, but the latter refutes such news, labeling it a strategic maneuver to cool oil prices. Trump promises escalated US military aggression on Iran’s electric power plants, oil wells, and the Kharg Island energy hub should these alleged talks prove unfruitful.
Meanwhile, the Fed has maintained a “wait and see” approach regarding interest rates, citing trade-offs between inflation and unemployment.
Uncertainty around these developments caused US spot Bitcoin ETFs to break a four-week positive streak, recording $296.18 million in net outflows in the week ending March 27.
As for on-chain indicators, the 1-week exchange whale ratio reads 0.57 according to blockchain analytics firm CryptoQuant. The metric indicates heightened Bitcoin whale offloading, which is typically interpreted as a bearish signal. This notion was supported by a drop in Bitcoin whale monthly demand growth to 1% in March from 6% in February.
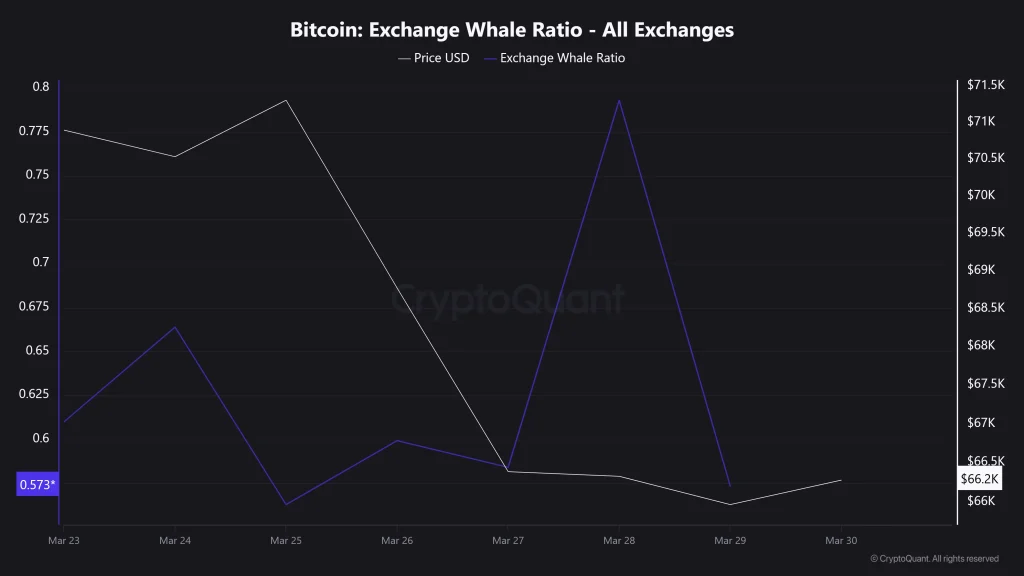
Source: CryptoQuant
The eventual yield of the bear to the bull
Crypto analysis by Ali Martinez shows the formation of a descending triangle pattern, a bearish setup based on historical trends. This projects a potential 2021-like crash, with a breakdown below $64,100 and towards $50,000.
Even more, he notes a crossover between the 50-day and 200-day simple moving averages on the 3-day chart, indicating an impending historical 40%-50% reset.
That said, Ali predicts potential buy zones if BTC bottoms out between $40K and $30K, adding that this phase would precede a major bull market.
Trust with CoinPedia:
CoinPedia has been delivering accurate and timely cryptocurrency and blockchain updates since 2017. All content is created by our expert panel of analysts and journalists, following strict Editorial Guidelines based on E-E-A-T (Experience, Expertise, Authoritativeness, Trustworthiness). Every article is fact-checked against reputable sources to ensure accuracy, transparency, and reliability. Our review policy guarantees unbiased evaluations when recommending exchanges, platforms, or tools. We strive to provide timely updates about everything crypto & blockchain, right from startups to industry majors.
Investment Disclaimer:
All opinions and insights shared represent the author's own views on current market conditions. Please do your own research before making investment decisions. Neither the writer nor the publication assumes responsibility for your financial choices.
Sponsored and Advertisements:
Sponsored content and affiliate links may appear on our site. Advertisements are marked clearly, and our editorial content remains entirely independent from our ad partners.