



 Advertise



Bitcoin Price: BTC To Hit $70K In Two Weeks, Michael van de Poppe




Michael van de Poppe predicts Bitcoin could rally toward $70K if momentum continues.
Bitcoin must reclaim $65.5K resistance before targeting the next major breakout above $70K
CryptoQuant data shows a bullish sign that short-term Bitcoin holders are buying the recent market dip.
Bitcoin’s price has gained nearly 2.7% today, slowly recovering from the Strategy’s $216 million Bitcoin sale earlier this week.
As of now, BTC is trading above last week’s high and nearing the key $65,543 resistance level. Popular crypto trader Michael van de Poppe believes Bitcoin is gaining strength and doesn’t expect the market to fall from here.
Here’s why.
Bitcoin Recorded A Strong Recovery
The largest cryptocurrency, Bitcoin, has finally moved back above last week’s price high, and is now trading around $64,410. Popular crypto analyst Michael van de Poppe believes the recent price action shows growing strength.
“There’s more strength coming in on BTC. That’s a great move, and I don’t expect to see the markets falling here.”

The daily BTC chart also supports this view.
Looking at it, Bitcoin has bounced from the recent descending trendline and is attempting to reclaim the 100-day moving average, while holding above the $60,876 support zone.
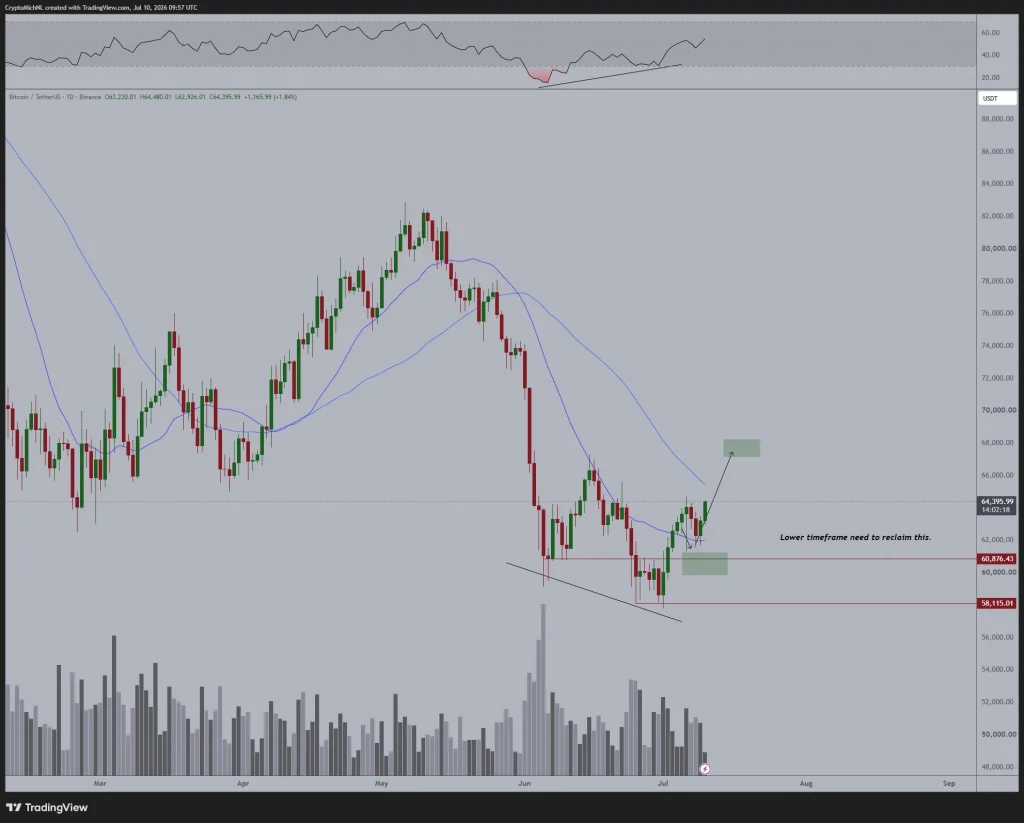
If buyers keep control, the next major target sits around $65,500-$66,000, with a possible move toward the $70,000 level in the next one to two weeks.
Bollinger Bands Are Tightening, Hinting at a Bigger Move
Well-known crypto analyst That Martini Guy also pointed to another bullish signal.
The Bollinger Bands have started tightening again after nearly a week of sideways trading. Historically, periods of lower volatility are often followed by sharp price moves.
According to the analyst, the most important task for Bitcoin is now to turn $64,000 into support.
If that happens, BTC could quickly challenge $65,543 before making a run toward $70,000.
Selling Pressure Is Easing On Bitcoin, Cryptoquant
CryptoQuant analyst Axel Adler Jr. sees a similar picture from Bitcoin’s on-chain data.
According to his Short-Term Holder Realized Pressure Model, spot selling pressure continues to weaken while buying activity is increasing.
The STH chart shows that during the recent decline toward the $62,000-$63,000 range, buying pressure once again moved ahead of selling pressure.
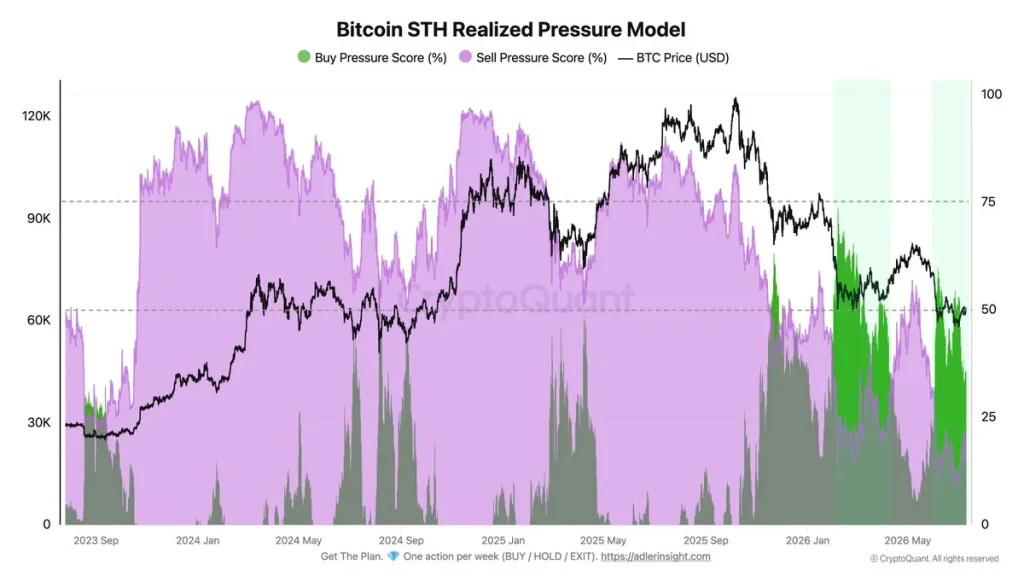
The chart reading shows buyers remain in control, with buying pressure around 30% compared to roughly 22% selling pressure.
Adler noted that short-term holders are buying the recent dip, similar to what happened earlier this year. Meanwhile, new buyers are still sitting in a small profit and are creating the nearest support zone around $63,600.
If buyers successfully push BTC above $65,500, analysts believe the path toward $70,000 could open much faster.
Loading profile preview
Loading profile preview
Loading profile preview
Was this writing helpful?

Trust with CoinPedia:
CoinPedia has been delivering accurate and timely cryptocurrency and blockchain updates since 2017. All content is created by our expert panel of analysts and journalists, following strict Editorial Guidelines based on E-E-A-T (Experience, Expertise, Authoritativeness, Trustworthiness). Every article is fact-checked against reputable sources to ensure accuracy, transparency, and reliability. Our review policy guarantees unbiased evaluations when recommending exchanges, platforms, or tools. We strive to provide timely updates about everything crypto & blockchain, right from startups to industry majors.
Investment Disclaimer:
All opinions and insights shared represent the author's own views on current market conditions. Please do your own research before making investment decisions. Neither the writer nor the publication assumes responsibility for your financial choices.
Sponsored and Advertisements:
Sponsored content and affiliate links may appear on our site. Advertisements are marked clearly, and our editorial content remains entirely independent from our ad partners.