



 Advertise



Bitcoin Indicators Flag Best Entry Point for Long-Term Investors




Long-term Bitcoin investors are now primed for accumulation as the Bitcoin Sharpe Ratio and the 200-week SMA are indicating final capitulation phases.
On-chain metrics such as exchange reserves and the RHODL ratio support this thesis.
Near-term boosters include prompt passing of the Clarity Act, while headwinds include the Middle East conflict.
A mantra among long-term investors is to buy when markets are panic selling, and several indicators show Bitcoin (BTC) might be in a prime accumulation zone.
Bitcoin indicators signal a strategic entry window
The first is the Sharpe Ratio, which is currently at -23. Sharpe ratio is an indicator that measures the risk-to-reward ratio. The higher it is, the greater the return on investment is and vice versa.
While considered rare statistical anomalies, extremely low readings of -20 to -23 signal a prime accumulation zone. They typically indicate the exhaustion of sell-side pressure and a reset in the risk/reward dynamic.
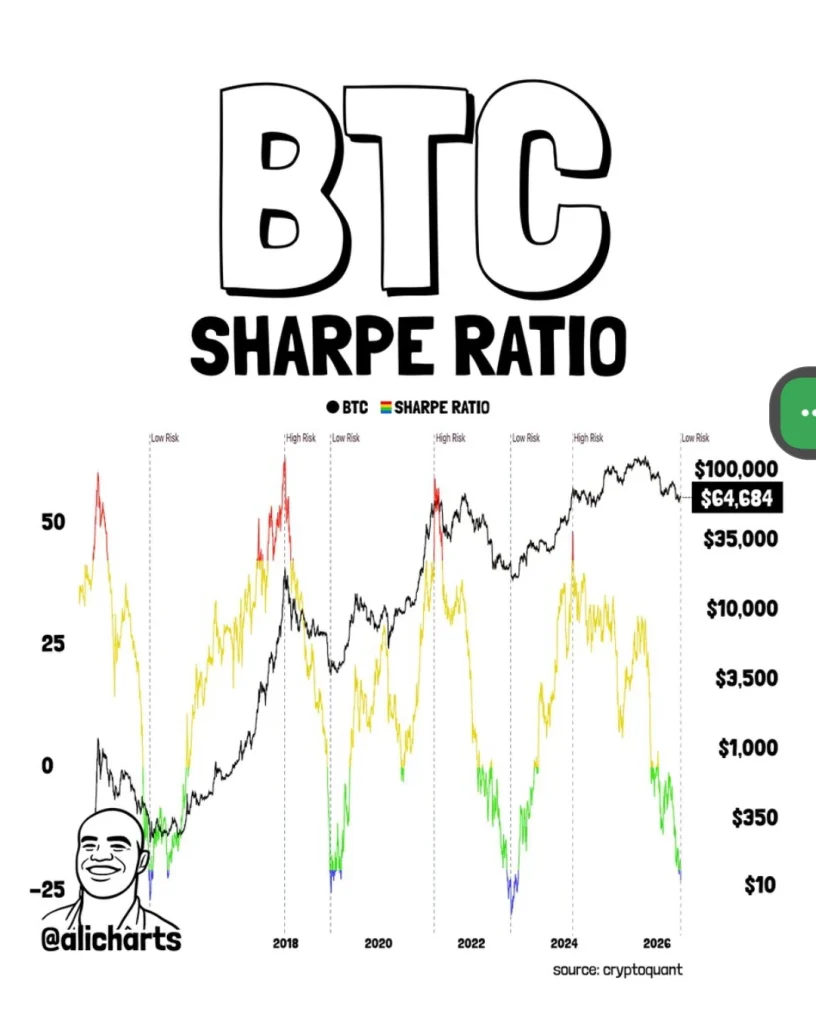
Source: CryptoQuant

Even more, the indicator has a pristine track record, showing cyclical pivots occurred after it fell to -20 or below. This happened in 2015, 2018-2019, and 2022-2023, during which it signaled macro bottoms and the onset of bull runs.
The catch
While the Sharpe Ratio holds a proven history of excellence, it is a lagging indicator. Once it shows, what follows are multiple months of consolidation before the trend flips upwards. The upside of this is that it allows gradual whale accumulation through Dollar Cost Averaging (DCA).
Supporting indicators and on-chain metrics
Several other indicators support the above macro accumulation zone theory. One is the Bitcoin Fear & Greed Index, which currently reads Fear. Another is the late June drop of the 200-week Simple Moving Average (SMA) below the then BTC price.
As for on-chain metrics, Bitcoin reserves in exchanges have been gradually declining, signaling a shift to long-term storage.
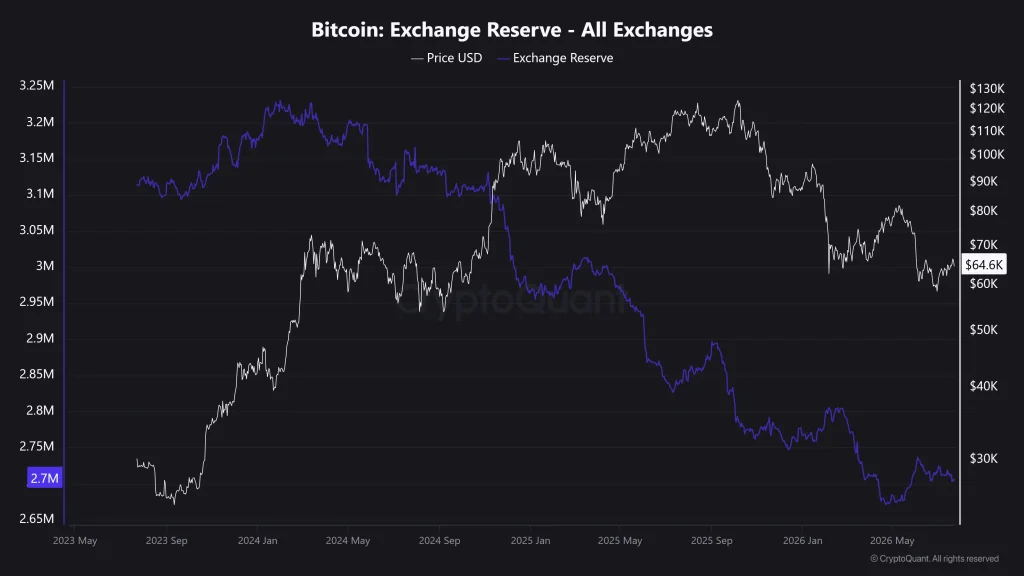
Source: CryptoQuant
Furthermore, the Realized HODL (RHODL) ratio is moving into the green band, signaling wealth rotation from short-term to long-term HODLers.
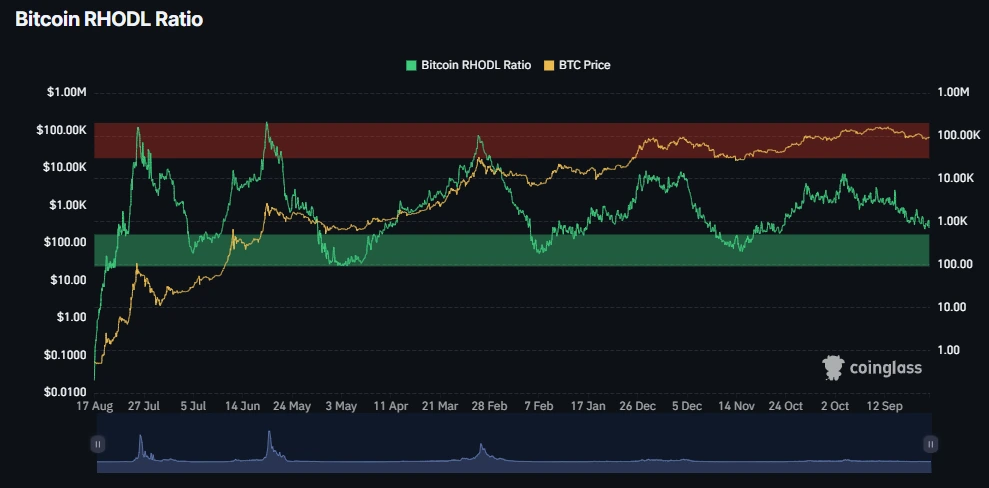
Source: CoinGlass
At press time, Bitcoin was trading at $64,710, down 1.47% in the day due to pressures from rising US bond yields and Middle East tensions. Near-term boosters include passage of the CLARITY Act into law before the August recess, while headwinds include an escalation of the US-Iran conflict.
Was this writing helpful?

Trust with CoinPedia:
CoinPedia has been delivering accurate and timely cryptocurrency and blockchain updates since 2017. All content is created by our expert panel of analysts and journalists, following strict Editorial Guidelines based on E-E-A-T (Experience, Expertise, Authoritativeness, Trustworthiness). Every article is fact-checked against reputable sources to ensure accuracy, transparency, and reliability. Our review policy guarantees unbiased evaluations when recommending exchanges, platforms, or tools. We strive to provide timely updates about everything crypto & blockchain, right from startups to industry majors.
Investment Disclaimer:
All opinions and insights shared represent the author's own views on current market conditions. Please do your own research before making investment decisions. Neither the writer nor the publication assumes responsibility for your financial choices.
Sponsored and Advertisements:
Sponsored content and affiliate links may appear on our site. Advertisements are marked clearly, and our editorial content remains entirely independent from our ad partners.