- Rizwan Ansari
 Rizwan Ansari
- Dec 26, 2025 13:20 UTC
-
Bitcoin Breakout Alert: 10x Research Sees Multi-Week Rally Pushing BTC To $110K
Bitcoin is currently going through a calm but tense phase as it faces $23.6 billion in option expiry today. After weeks of heavy selling in October and November, the market is trying to find stability.
According to recent analysis from 10x Research, Bitcoin has triggered a bullish breakout that may signal the start of a multi-week recovery, with upside potential toward $110K if momentum holds.
October Crash and ETF Outflows Weighed Heavily on Bitcoin
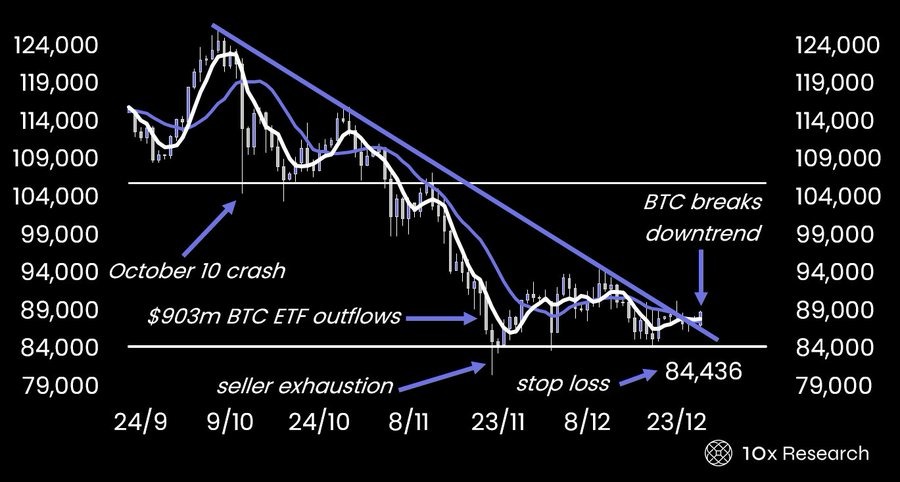
According to 10x Research, Bitcoin’s current price structure began with the sharp October 10 crash, when BTC fell from its peak near $98,000, and the broader crypto market saw about $19 billion in liquidations.
Pressure increased after the October 29 Federal Reserve meeting, which delivered a hawkish message. Soon after, spot Bitcoin ETFs recorded heavy selling, with nearly $903 million in net outflows. This drained liquidity and kept Bitcoin stuck under selling pressure.
Even when prices looked attractive, buyers remained cautious. As a result, the downtrend lasted longer than many traders expected.
By late November, selling began to fade as most short-term sellers had exited. However, instead of rebounding, capital shifted to assets like gold and silver, leaving Bitcoin stuck in a slow recovery.
$85,000 Becomes a Strong Support Level
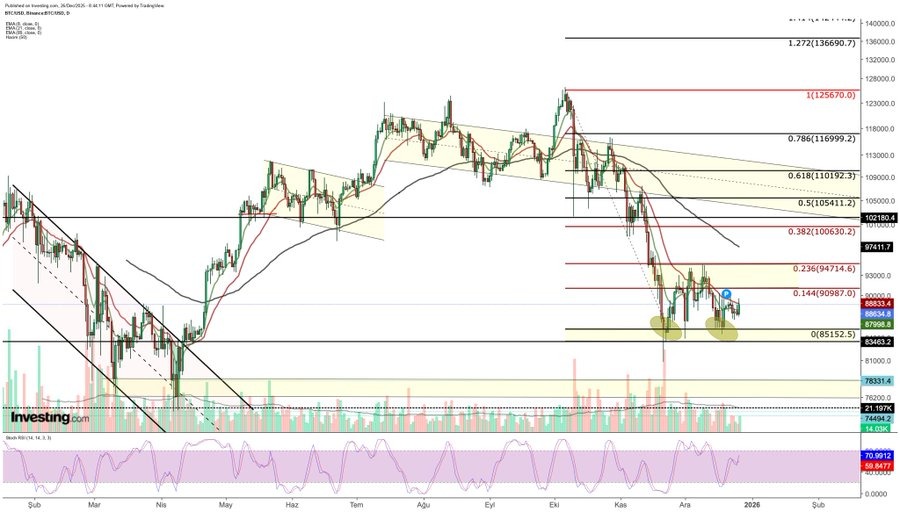
From a chart perspective, Bitcoin recently moved above its descending trendline, signaling potential trend exhaustion. Key support near the $85,000 zone held firm, strengthening buyer confidence. As long as Bitcoin stays above this zone, the market avoids deeper losses.
Even though Bitcoin has tried to move above $92K but failed several times, one major reason is low trading volume, which is common near year-end.
With fewer traders active, price moves lack strength. As a result, recent rises look like short pauses, not a true trend shift.
Resistance Levels Hold the $110000 Level Back
On the upside, Bitcoin faces heavy resistance. The first level to watch is $91,000, which could signal the end of consolidation if broken. The bigger hurdle lies near $94,700, a key level that could shift market sentiment.
If Bitcoin clears these zones, upside targets sit near $100,600, $105,400, and $110,000.
As of now, BTC is trading $88,656, reflecting a jump of 1.5% seen in the last $1.77 trillion.
Trust with CoinPedia:
CoinPedia has been delivering accurate and timely cryptocurrency and blockchain updates since 2017. All content is created by our expert panel of analysts and journalists, following strict Editorial Guidelines based on E-E-A-T (Experience, Expertise, Authoritativeness, Trustworthiness). Every article is fact-checked against reputable sources to ensure accuracy, transparency, and reliability. Our review policy guarantees unbiased evaluations when recommending exchanges, platforms, or tools. We strive to provide timely updates about everything crypto & blockchain, right from startups to industry majors.
Investment Disclaimer:
All opinions and insights shared represent the author's own views on current market conditions. Please do your own research before making investment decisions. Neither the writer nor the publication assumes responsibility for your financial choices.
Sponsored and Advertisements:
Sponsored content and affiliate links may appear on our site. Advertisements are marked clearly, and our editorial content remains entirely independent from our ad partners.