Imagine you’re driving on a long road trip. You’ve been seeing nothing but flat roads and cloudy skies. But then, suddenly, the sun starts peeking through the clouds, and the road ahead begins to slope upward. That’s the moment you realize—you’re headed toward something better.
That’s exactly how the Golden Cross feels in trading. It’s a moment when the market shifts gears, signaling the potential for a strong upward trend. But what exactly is it? And more importantly, how can you use it to make better trading decisions?
Let’s dive in.
What Is the Golden Cross?
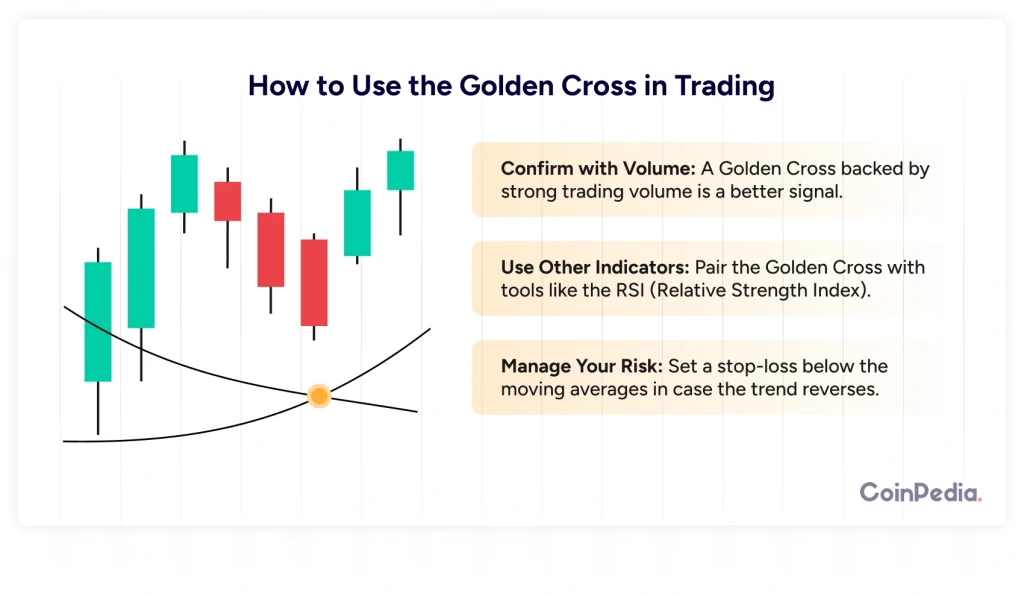
The Golden Cross is a bullish signal that happens when a short-term moving average (usually the 50-day) crosses above a long-term moving average (typically the 200-day). This crossover suggests that momentum is shifting upward, and traders see it as a sign that a strong uptrend might be coming.
Think of it like a train picking up speed. At first, it moves slowly, but once it gathers enough momentum, it becomes hard to stop.
This indicator is widely used in stocks, forex, crypto, and commodities trading, making it a favorite among technical analysts.
How Does the Golden Cross Work?
To break it down, a Golden Cross happens in three key stages:
- Downtrend Weakens – The price has been declining, and the short-term moving average is below the long-term moving average.
- Crossover Occurs – The short-term moving average rises and crosses above the long-term moving average.
- Uptrend Begins – After the crossover, the market often enters a strong bullish phase as more traders jump in, expecting higher prices.
Why Is the Golden Cross So Important?
There are thousands of trading signals out there, but the Golden Cross stands out because:
- It’s reliable – While no signal is foolproof, the Golden Cross has a history of predicting strong bull markets.
- It’s easy to spot – Unlike complex indicators, you just need two moving averages on your chart.
It works across all markets – Whether you’re into stocks, crypto, forex, or commodities, the Golden Cross applies everywhere.
Golden Cross in Action: Real-World Examples
1. Bitcoin’s Golden Cross (2020)
In April 2020, Bitcoin’s 50-day moving average crossed above the 200-day moving average. This happened right before the massive bull run that saw BTC skyrocket from around $7,000 to over $60,000 in less than a year.
2. S&P 500 (2019)
In early 2019, the S&P 500 formed a Golden Cross, signaling the start of a major uptrend. It was a sign that the market had recovered from the late 2018 dip, and it continued to rally for most of the year.
How to Use the Golden Cross in Trading
The Golden Cross alone doesn’t guarantee profits. Here’s how to use it wisely:
1. Confirm with Volume
- A Golden Cross backed by strong trading volume is a better signal. If there’s little volume, the move could be weak.
2. Use Other Indicators
- Pair the Golden Cross with tools like the RSI (Relative Strength Index) to avoid buying overbought assets.
- Look at support and resistance levels to confirm strong breakout points.
3. Manage Your Risk
- Set a stop-loss below the moving averages in case the trend reverses.
Don’t go all-in. Use position sizing to manage exposure.

Golden Cross vs. Death Cross
If the Golden Cross is a bullish signal, the Death Cross is the opposite. It happens when the 50-day moving average crosses below the 200-day moving average, signaling a potential downtrend.
Think of it as a storm warning after clear skies.
For example, the S&P 500 had a Death Cross in March 2020, just before the COVID-19 crash. Traders who recognized this signal had the chance to exit or short the market before major losses.
Common Mistakes to Avoid
Even though the Golden Cross is powerful, many traders make mistakes when using it:
- Chasing the Signal Late – By the time the crossover happens, the price may have already moved significantly.
- Ignoring Market Conditions – If the market is highly volatile, the Golden Cross can fail.
- Not Checking for False Signals – Sometimes, moving averages cross only to reverse later. Always confirm with other indicators.
Final Thoughts
The Golden Cross is a fantastic tool, but like any strategy, it’s not perfect. Think of it as a compass—it points you in the right direction, but you still need to navigate wisely.
If you combine it with proper risk management, volume confirmation, and other technical indicators, it can be a game-changer in your trading strategy.So, the next time you see a Golden Cross forming, ask yourself: Is this the start of a major move? If the signs align, you just might be in for an exciting ride!
FAQs
A Golden Cross occurs when a short-term moving average (50-day) crosses above a long-term moving average (200-day), signaling a potential uptrend.
Traders buy after the crossover, confirm with volume and RSI, and set stop-losses below moving averages to manage risk effectively.
Yes, false signals can occur, especially in volatile markets. Always confirm with volume, RSI, and support/resistance levels before trading.
While not foolproof, the Golden Cross is a strong bullish indicator, especially when confirmed by high volume and other technical analysis tools.
A Golden Cross signals an uptrend (bullish), while a Death Cross occurs when the 50-day moves below the 200-day, signaling a downtrend (bearish).
Well Done! You have now completed the Lesson.
Complete the Quiz and Get Certified! All The Best!
We'd Love to Hear Your Thoughts on This Article!
Was this writing helpful?
 Yes
Yes  No
No
Disclaimer and Risk Warning
The information provided in this content by Coinpedia Academy is for general knowledge and educational purpose only. It is not financial, professional or legal advice, and does not endorse any specific product or service. The organization is not responsible for any losses you may experience. And, Creators own the copyright for images and videos used. If you find any of the contents published inappropriate, please feel free to inform us.


