Qadir AK

Qadir AK

Author
Qadir Ak is the founder of Coinpedia. He has over a decade of experience writing about technology and has been covering the blockchain and cryptocurrency space since 2010. He has also interviewed a few prominent experts within the cryptocurrency space.
Reviewed by:

Mustafa Mulla

Reviewed
Mustafa has been writing about Blockchain and crypto since many years. He has previous trading experience and has been working in the Fintech industry since 2017.
- Nov 01, 2023 06:09 UTC
Aroon Oscillator: A Must-Read for Beginners in Crypto Trading
The first thing a new cryptocurrency trader should understand is that they should never let their emotions affect their trading decisions. Traders often forget this when assessing the strength of a trend. If a trader relies on non-emotional factors, like indicators, they can avoid making mistakes. This is where the importance of indicators like Aroon Oscillator, which can accurately measure the strength of a trend, becomes relevant. Let’s explore this interesting indicator in more detail.
1. Aroon Oscillator: All You Should Know
The Aroon indicator, created by Tushar Chande in 1995, assesses a trend’s strength by considering how long an asset’s price stays above or below a specific level.
2. Working of Aroon Oscillator: The Basics
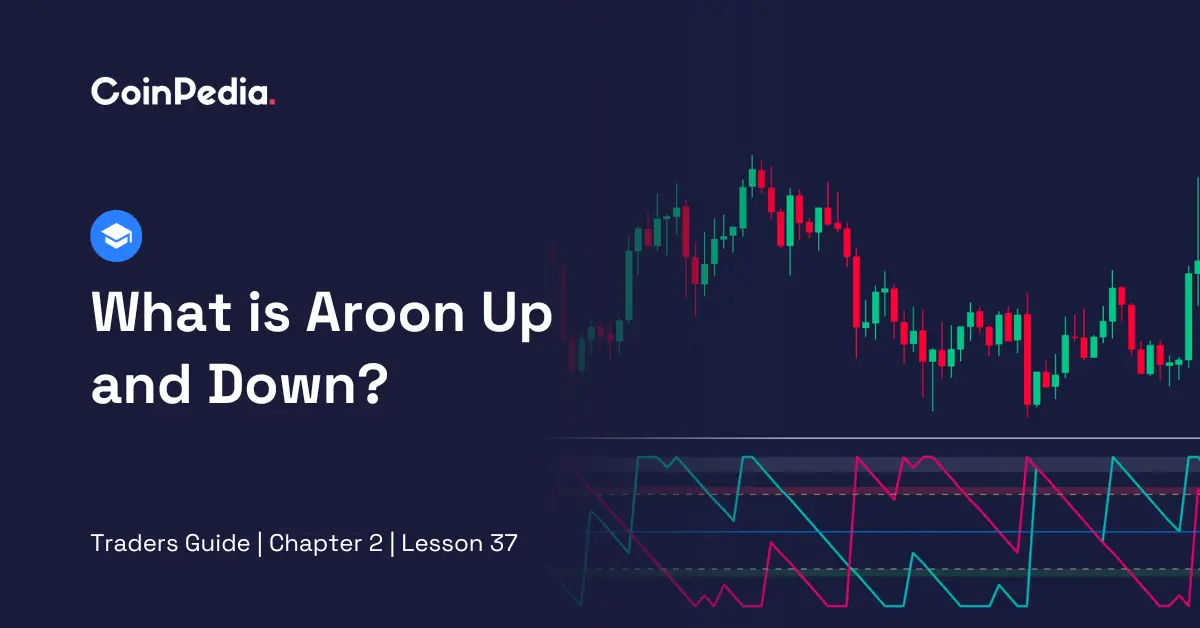
The Aroon Oscillator measures if a financial trend is going up or down. It is typically represented as a single line, known as the Aroon Oscillator line, which moves above and below a central zero line. To derive this line, it considers two factors: Aroon Up (how strong the uptrend is) and Aroon Down (how strong the downtrend is). By subtracting Aroon Down from Aroon Up, you get the Oscillator line.
3. Calculating Aroon Oscillator
Calculating Aroon Oscillator requires these three simple formulas:
| Aroon Up = [(Number of periods – Number of periods since the highest high) / Number of periods] * 100 |
| Aroon Down = [(Number of periods – Number of periods since the lowest low) / Number of periods] * 100 |
They measure the time an asset’s price reaches the highest and lowest points over a certain period.
Once they are calculated, time to proceed to the final step.
| Aroon Oscillator = (Aroon Up – Aroon Down) * 100 |
The Aroon Oscillator is calculated by taking the difference between Aroon Up and Aroon Down, and then multiplying that difference by 100.
4. Launching Aroon Oscillator on a TradingView Chart: A Step-by-Step Guide
Here are the simple steps to launch the Aroon Oscillator on a TradingView chart:
- Step 1: Sign In to TradingView
Log in to your TradingView account.
- Step 2: Search for a Chart
Find a specific chart or select a random one you want to analyse.
- Step 3: Launch the Chart
Click on the chart to open it
- Step 4: Locate the ‘Indicator’ tab
At the top of the chart, you will see a toolbar. Click on the ‘Indicator’ tab.
- Step 5: Find Aroon Indicator
In the search bar, type ‘Aroon Oscillator’ to locate the indicator.
- Step 6: Add to Chart
Click on the Aroon indicator from the search results, and then click the ‘Add to Chart’ button.
- Step 7: Configure the Indicator
You can adjust the settings of the Aroon Oscillator, like the number of periods, to fit your analysis by clicking on the settings icon.
- Step 8: Start Analysis
Once configured, you will see the Aroon Oscillator line on your chart. Analyse the Aroon line to assess the strength of trends.
5. How to Read Aroon Oscillator
The Aroon Oscillator indicator is commonly used to measure the strength of a trend.
- Trend Strength
If the Aroon Oscillator is positive, it signals a strong upward trend. If it is negative, it suggests a strong downward trend.
The bigger the number (positive or negative), the stronger the trend.
- Divergence
If the Aroon Oscillator is moving in the opposite direction to the price trend, it might signal a potential reversal.
Endnote
The Aroon Oscillator is a valuable tool for assessing trends in trading. It helps traders understand whether an uptrend or downtrend is emerging and how strong it is. By following the steps to launch the Aroon Oscillator on TradingView, traders can gain insights into market movements and make informed decisions. Remember that understanding how to read the Aroon Oscillator line is essential for successful trend analysis, ultimately helping traders navigate the complex world of financial markets more effectively.
Well Done! You have now completed the Lesson.
Complete the Quiz and Get Certified! All The Best!
We'd Love to Hear Your Thoughts on This Article!
Was this writing helpful?
 Yes No
Disclaimer and Risk Warning
The information provided in this content by Coinpedia Academy is for general knowledge and educational purpose only. It is not financial, professional or legal advice, and does not endorse any specific product or service. The organization is not responsible for any losses you may experience. And, Creators own the copyright for images and videos used. If you find any of the contents published inappropriate, please feel free to inform us.


