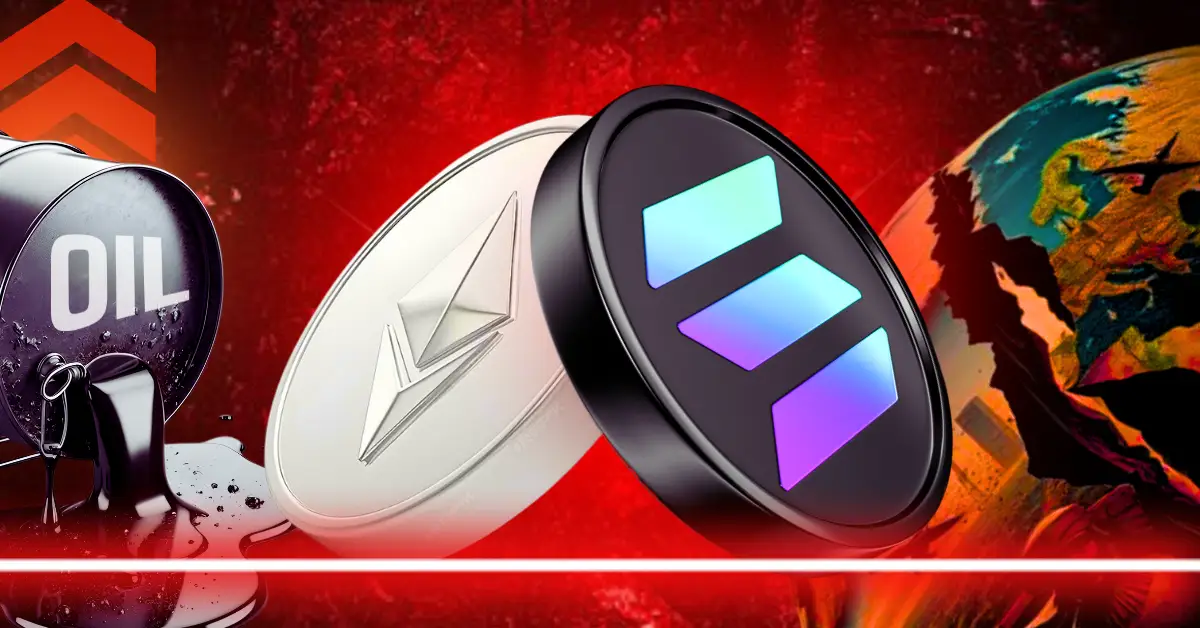
ETH and SOL price action just walked into a geopolitical storm and it doesn’t feel subtle at all. A proposed 4-6 week deadline to resolve the Iran conflict, alongside rising oil prices and troop deployments, is injecting fresh uncertainty into already fragile markets. And when macro tension rises, risk assets like crypto don’t exactly get a free pass, especially altcoins. So yeah, buckle up. This window could get messy.
Well, we know since this was announced, oil prices are already climbing again, inflation fears are creeping back in, and suddenly the appetite for risk looks… shaky. That’s usually bad news for assets like Ethereum and Solana, which thrive when liquidity flows freely.
But we need to be more realistic on this situation. We have always seen that crypto doesn’t always follow the script. Also, decentralized systems sometimes shine in chaos. Still, in the short term, pressure is pressure and right now, it’s building that leaves us at uncertainty for now.
But, one thing is clear and that is price action that shows for now that the ETH price action is rejected by $2400. That level is acting like a ceiling and trapping price and putting it in a frustrating consolidation range.
But zoom out a bit, and things look less comforting. The structure hints at an ascending channel, and when paired with January’s sharp drop, it starts resembling a bearish continuation setup. Not exactly what bulls want to hear.
Therefore, Ethereum price analysis highlights whether that pattern plays out? Bears could aim as low as $1500. And the indicators aren’t helping calm nerves either. MACD just flashed a bearish cross. RSI slipped below 50. AO is leaning bearish, and CMF has already turned down from mid-March highs, hovering close to neutral and threatening to dip negative. Not a sure shot collapse signal yet, but definitely not confidence-inspiring either.
Now flipping over to SOL price analysis, and it’s like watching a slightly delayed version of the same movie.
Price action suggests a similar channel structure, with $97 acting as a key resistance. If that level keeps rejecting, consolidation could stretch across this entire 4–6 week window.
But if the structure breaks? Downside targets around $50 start coming into play. Indicators back that cautious tone. RSI has already dipped below 50. AO shows rising bearish momentum. CMF is sitting at -0.02, signaling capital outflows. The only difference? MACD hasn’t confirmed a bearish cross yet, but it’s not exactly screaming strength either.
So, what’s next? To sum-up, this 4–6 week period isn’t just another timeline in fact it’s a pressure cooker. Between geopolitical tension, rising oil prices, and weakening technical structures, both ETH and SOL price trends are entering a critical phase.
If stability returns, maybe consolidation holds. But if macro stress escalates, the downside scenarios on ETH and SOL price charts might not stay theoretical for long.
CoinPedia has been delivering accurate and timely cryptocurrency and blockchain updates since 2017. All content is created by our expert panel of analysts and journalists, following strict Editorial Guidelines based on E-E-A-T (Experience, Expertise, Authoritativeness, Trustworthiness). Every article is fact-checked against reputable sources to ensure accuracy, transparency, and reliability. Our review policy guarantees unbiased evaluations when recommending exchanges, platforms, or tools. We strive to provide timely updates about everything crypto & blockchain, right from startups to industry majors.
All opinions and insights shared represent the author's own views on current market conditions. Please do your own research before making investment decisions. Neither the writer nor the publication assumes responsibility for your financial choices.
Sponsored content and affiliate links may appear on our site. Advertisements are marked clearly, and our editorial content remains entirely independent from our ad partners.
After consolidating within a pre-defined range, the Dogecoin price is showing early signs of recovery.…
Avalanche (AVAX) price hovered near $6.65 after climbing more than 3% this week, recovering from…
The XDC price has spent months sliding from its 2025 peak of $0.1567 to around…
The Dango shutdown is now official, ending months of uncertainty for the decentralized trading platform…
Forget the stereotype of young investors chasing meme trades. According to Binance Research, Gen Z…
Shiba Inu price is approaching another make-or-break moment as improving on-chain activity begins to challenge…

