Have you ever looked at a chart and wondered if there’s a way to predict where the price might go next? What if I told you that traders have been using a simple mathematical tool for decades to find hidden support and resistance levels? That tool is called Fibonacci retracement, and when combined with price action, it can be a game-changer.
In this guide, we’ll break it down step by step. No complex jargon, just clear explanations and practical tips. Ready? Let’s dive in!
Fibonacci retracement is based on the Fibonacci sequence, a series of numbers where each one is the sum of the two before it (1, 1, 2, 3, 5, 8, 13, and so on). When these numbers are turned into ratios, they create levels that traders use to predict price movements.
The most commonly used Fibonacci retracement levels are:
These levels act as potential support or resistance areas. In simple terms, they are points where the price might bounce or reverse.
Let’s keep this simple.
Example: Imagine Bitcoin is in an uptrend, rising from $40,000 to $50,000. You plot Fibonacci from $40,000 (swing low) to $50,000 (swing high). If the price retraces to the 61.8% level at $44,000 and finds support, it could be a great buying opportunity.
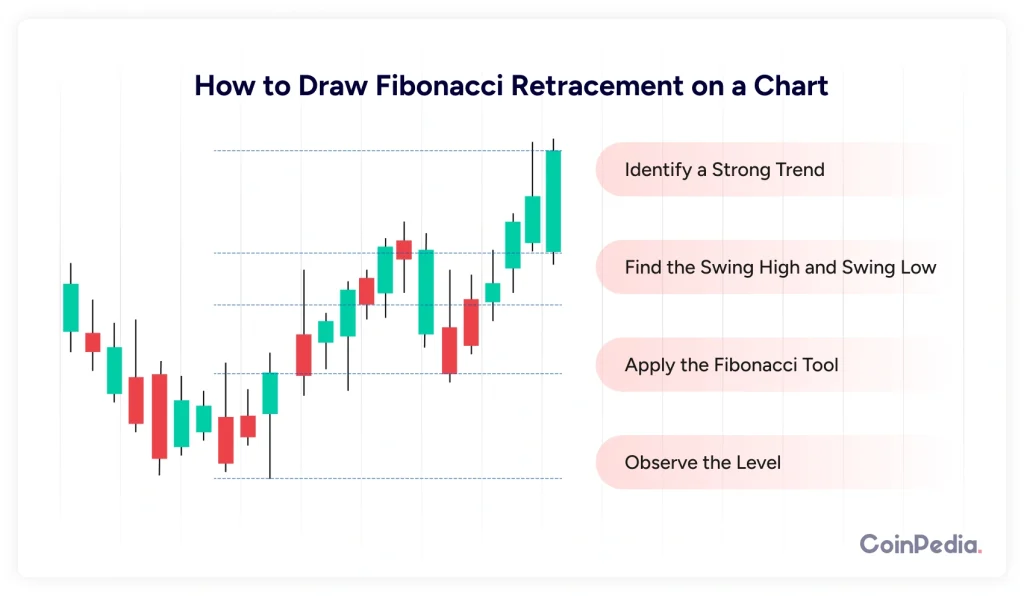
Fibonacci levels alone don’t guarantee success. That’s where price action comes in. Price action is the study of how price moves and reacts at certain levels.
So, when price reaches a Fibonacci level, we need confirmation before making a trade. Here’s how:
Also Read: Creating Excellent Price Action Strategies using Breakout Pullbacks
Now that you understand Fibonacci retracement and price action, let’s combine them into actionable strategies.
This strategy is for traders who want to ride the trend.
Example: Ethereum is trending up from $2,000 to $2,500. After hitting $2,500, it pulls back to $2,300 (61.8% retracement). A bullish engulfing candle forms. This signals a good entry point to buy.
Sometimes, Fibonacci retracement levels act as resistance, leading to trend reversals.
Example: Bitcoin surges from $30,000 to $40,000, then retraces to $37,000 (78.6% level). A shooting star candle appears, signaling a reversal. This could be a shorting opportunity.
Many traders misuse Fibonacci retracement. Here’s how to avoid common mistakes:
Fibonacci retracement is a powerful tool, but it’s not magic. When combined with price action, it helps traders find high-probability trades. The key is patience—wait for confirmation, manage risk, and stick to your strategy.
Now it’s your turn. Open your charts, plot Fibonacci retracement, and see how price reacts. With practice, you’ll start spotting opportunities like a pro!
Yes, Fibonacci retracement works on all timeframes, but its reliability increases on higher time frames like the 1-hour, 4-hour, daily, and weekly charts. Lower time frames (e.g., 1-minute or 5-minute) may have more noise, making the levels less effective.
Yes! Many traders place their stop-loss slightly beyond the nearest Fibonacci retracement level. For example, if you enter at the 61.8% retracement level, placing a stop just below the 78.6% level can help manage risk.
Fibonacci retracement is most effective in trending markets. In ranging markets, price action is choppy, making it harder to find reliable retracement levels.
Absolutely! Traders often combine Fibonacci retracement with moving averages, RSI (Relative Strength Index), MACD, or trendlines for stronger confirmations before entering a trade.
Fibonacci levels do not always hold, which is why price action confirmation is crucial. The effectiveness of Fibonacci depends on market conditions, volume, and overall trend strength.
CoinPedia has been delivering accurate and timely cryptocurrency and blockchain updates since 2017. All content is created by our expert panel of analysts and journalists, following strict Editorial Guidelines based on E-E-A-T (Experience, Expertise, Authoritativeness, Trustworthiness). Every article is fact-checked against reputable sources to ensure accuracy, transparency, and reliability. Our review policy guarantees unbiased evaluations when recommending exchanges, platforms, or tools. We strive to provide timely updates about everything crypto & blockchain, right from startups to industry majors.
All opinions and insights shared represent the author's own views on current market conditions. Please do your own research before making investment decisions. Neither the writer nor the publication assumes responsibility for your financial choices.
Sponsored content and affiliate links may appear on our site. Advertisements are marked clearly, and our editorial content remains entirely independent from our ad partners.
After a significant upswing, the Hedera (HBAR) price has been facing strong upward pressure. While…
“Black Monday” is trending on social media ahead of Wall Street’s open on October 19,…
According to David Schwartz, the chief architect of the XRP Ledger and Ripple’s CTO Emeritus,…
There is more money in the world than ever before, yet Bitcoin is not rising…
The Sandbox price has gained significant attention in the past few weeks, with a surge…
VeChain (VET) is approaching a critical technical test as investors look for blockchain projects that…


