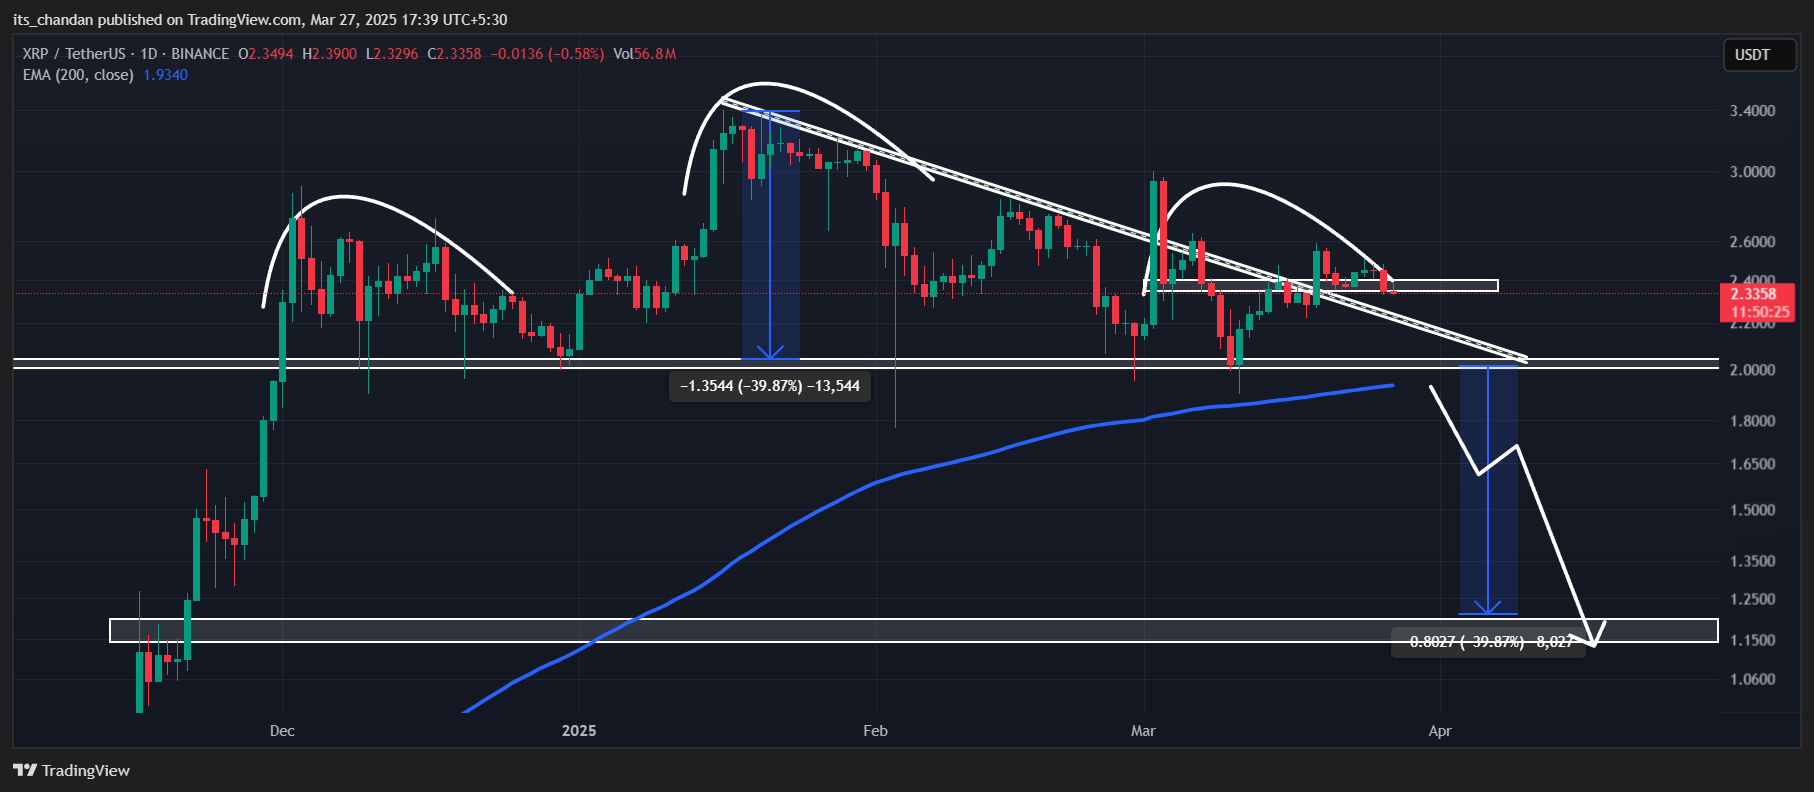
Amid the ongoing market uncertainty, the XRP price failed to sustain its recent breakout above the descending trendline and a crucial horizontal level of $2.40. The price’s fall below this key level has once again shifted market sentiment, and it appears to be forming a bearish price action pattern.
According to CoinPedia’s technical analysis, XRP remains in an uptrend as it continues to trade above the 200 Exponential Moving Average (EMA) on the daily timeframe. However, falling below the key $2.40 level has now paved the way for a potential drop to $2 in the coming days.
For now, $2 is a crucial make-or-break level that could determine whether the price recovers its losses or experiences a further decline.
As of now, XRP appears to be forming a bearish head-and-shoulders pattern. The $2 level acts as a neckline, which could serve as a make-or-break level.
The potential neckline at $2 is a key level where the 200 EMA also appears to be providing support for XRP’s price. However, if market sentiment remains unchanged and the price falls below this level, a sharp sell-off could occur, pushing XRP down by 37% to $1.20 in the future.
However, this bearish price prediction is only valid if XRP’s price falls below the $2 level; otherwise, the asset has a high potential to regain all its losses. This price drop and negative sentiment likely stem from the ongoing tariff wars.
At press time, XRP is trading near $2.32, having dropped 2.50% in the past 24 hours. However, during the same period, its trading volume surged by 10%, indicating increased participation from traders and investors compared to previous days.
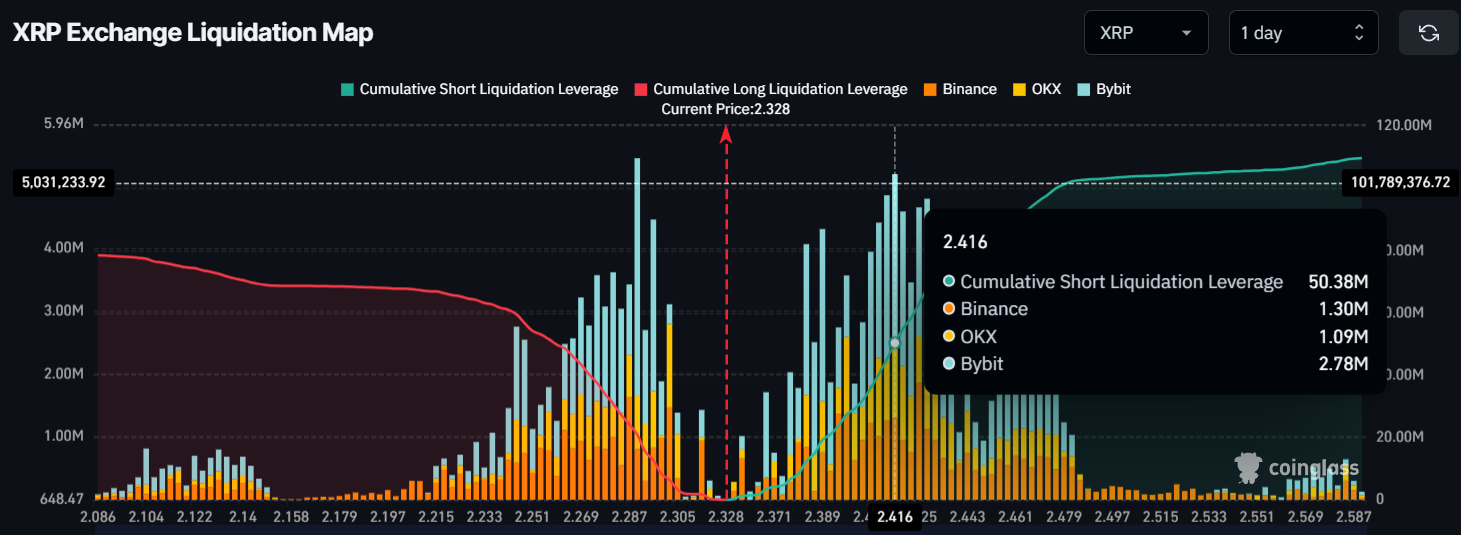
The price drop below the $2.40 level has turned trader sentiment bearish, as they appear to be strongly betting on the short side, according to on-chain analytics firm Coinglass.
Data reveals that traders are over-leveraged at $2.29 on the lower side and $2.416 on the upper side, having built $20.85 million in long positions and $51 million in short positions over the past 24 hours.
The buildup of leveraged short positions signals heightened bearish sentiment. If this imbalance continues, XRP could face increased selling pressure.
El Salvador’s Bitcoin journey is facing fresh doubts. The government says it’s still buying BTC…
The Dogecoin price is once again at the center of crypto market attention. After a…
XRP has bounced back from the $3 support level and is now trading around $3.20.…
Maksym Sakharov, CEO of decentralized bank WeFi, says Japan’s slow and cautious regulatory process is…
A quiet $9 billion Bitcoin sale has now turned into a major controversy and it…
South Korea is racing to finalize a trade agreement with the U.S. before August 1,…