Following a brief correction, the Hyperliquid price slid below $40 during the early trading sessions with a plunge of nearly 1.5%. The descending trend was triggered soon after a rejection from the local highs at $43.1. Moreover, the crypto reportedly witnessed over $2M in whale exits following the failed breakout attempt.
Structurally, HYPE is still in an uptrend on a higher timeframe, but momentum is clearly slowing and liquidity looks thinner near the highs. Price broke $43.7 earlier, tagged $45.7, then immediately faded back under $40 support retest. That’s not a strong continuation, but hesitation. This raises speculations about whether the Hyperliquid price is gearing up to chase highs or is still stuck within a bearish trend.
HYPE has broken below its key structure, losing the support it held since the start of the year. With selling pressure building, attention now shifts to whether bulls can defend the $38 level, as a breakdown could extend the pullback toward the $35 support zone.
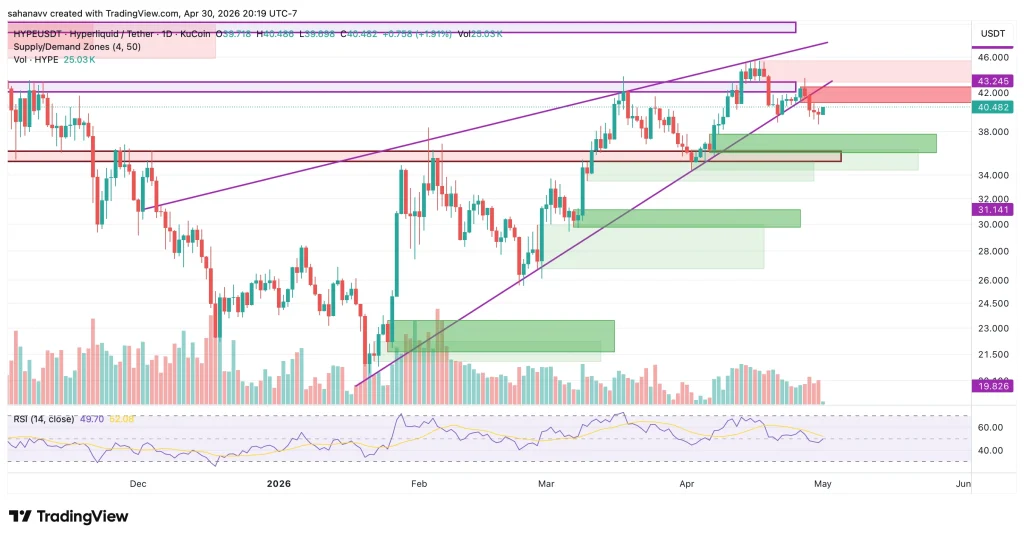
As seen in the chart, Hyperliquid (HYPE) has turned lower after breaking down from a rising wedge pattern, signaling a shift in short-term momentum toward the downside. The RSI has flipped bearish and continues to trend lower, showing little sign of recovery and reinforcing the weakening structure.
With selling pressure building, the price now risks slipping below the $38–$37 support range, where a key demand zone may attract buyers. However, the current setup suggests that any bounce could remain limited unless strong demand emerges. On the upside, the $43–$46 zone continues to act as a firm resistance ceiling, capping recovery attempts. Meanwhile, the $40 level has become a critical battleground, with the price struggling to sustain itself above it.
If Hyperliquid fails to hold the immediate support zone, the correction could extend toward the $35–$34.5 region. A breakdown below this level would significantly weaken the broader bullish structure and open the door for deeper downside. Overall, the chart reflects a market shifting into a corrective phase after losing key structure. Unless buyers defend the lower support zones and reclaim the $40–$43 range, HYPE’s price remains vulnerable to further downside in the near term.
The WLD price is approaching a make-or-break zone. The weekly chart shows resistance between $0.56…
The NEAR price is pushing higher again after bouncing from $4.34 support, and bulls are…
NEAR Protocol (NEAR) & Worldcoin (WLD) prices have turned out to be among the top…
How can beginners participate in computing infrastructure and earn rewards without buying mining equipment or…
China could become a major driver of the next crypto market cycle if it finds…
Amazon (AMZN) stock climbed 3.29% on Friday, putting its next major resistance level at $280…

