After consolidating for nearly five days, Bitcoin (BTC), the world’s largest cryptocurrency by market cap, appears to be flashing a warning signal. This negative signal from BTC has shifted overall market sentiment.
According to CoinPedia’s technical analysis, BTC has breached the lower side of the consolidation zone and has started moving downward. Based on recent price action, if BTC closes a daily candle below or near the $95,000 level, there is a strong possibility it could decline by 10% to reach the $86,300 level in the coming days.
At present, the asset is trading above the 200 Exponential Moving Average (EMA) on the daily timeframe, indicating an uptrend. Meanwhile, its Relative Strength Index (RSI) has surpassed 70, suggesting limited room for further upside momentum.
The RSI is a technical indicator used to determine whether an asset is in an oversold or overbought area. Traders and investors build positions based on its behavior.
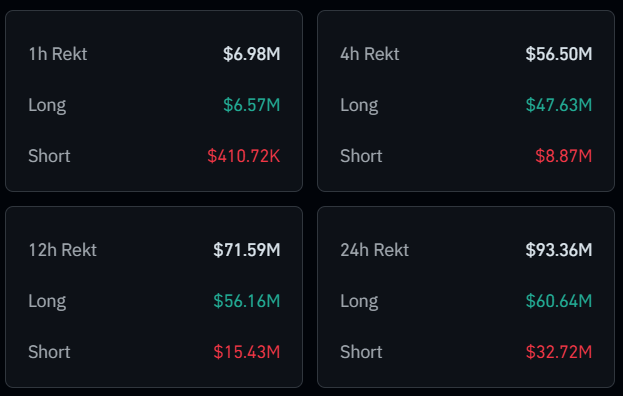
This breakdown in BTC has liquidated millions of dollars worth of long positions, according to the on-chain analytics firm Coinglass.
The data reveals that traders have liquidated a significant $47.65 million worth of long positions in the past four hours, compared to $8.87 million worth of short positions. Additionally, in the past hour, traders liquidated $6.65 million worth of long positions and $410,000 worth of short positions.
This significant liquidation of long positions compared to short positions suggests that bears are back in the market and could propel the BTC price lower in the coming days.
However, this crucial breakdown occurred after MicroStrategy, the world’s largest corporate Bitcoin holder purchased a significant 55,000 BTC worth $5.4 billion, and the medical firm Semler Scientific acquired $30 million worth of BTC.
At press time, BTC is trading near $95,135 and has experienced a price decline of 1.05% in the past 24 hours. During the same period, its trading volume jumped by 38%, indicating heightened participation from traders and investors amid price breakdown.
The crypto market pulses with activity as XRP tests key resistance levels, PEPE hints at…
As investors scan the market for their next big move, one token is beginning to…
Shiba Inu (SHIB), the wildly popular meme coin, has once again made a splash in…
Over the past week, Pepe Coin (PEPE) has seen a sharp rise of around 42%,…
Over the past week, a handful of altcoins broke away from the market consolidation, delivering…
After a long, painful stretch for altcoins, the market is finally showing signs of recovery.…