Professional crypto traders generally do not use basic crypto trading indicators. They always prefer advanced crypto trading indicators. If you want to graduate from an entry-level crypto trader to the level of a professional cryptocurrency trader, you should try to learn advanced crypto technical indicators. If you are keen to explore the next level of indicators, you should start with William %R. Let’s move to the advanced level! Ready?
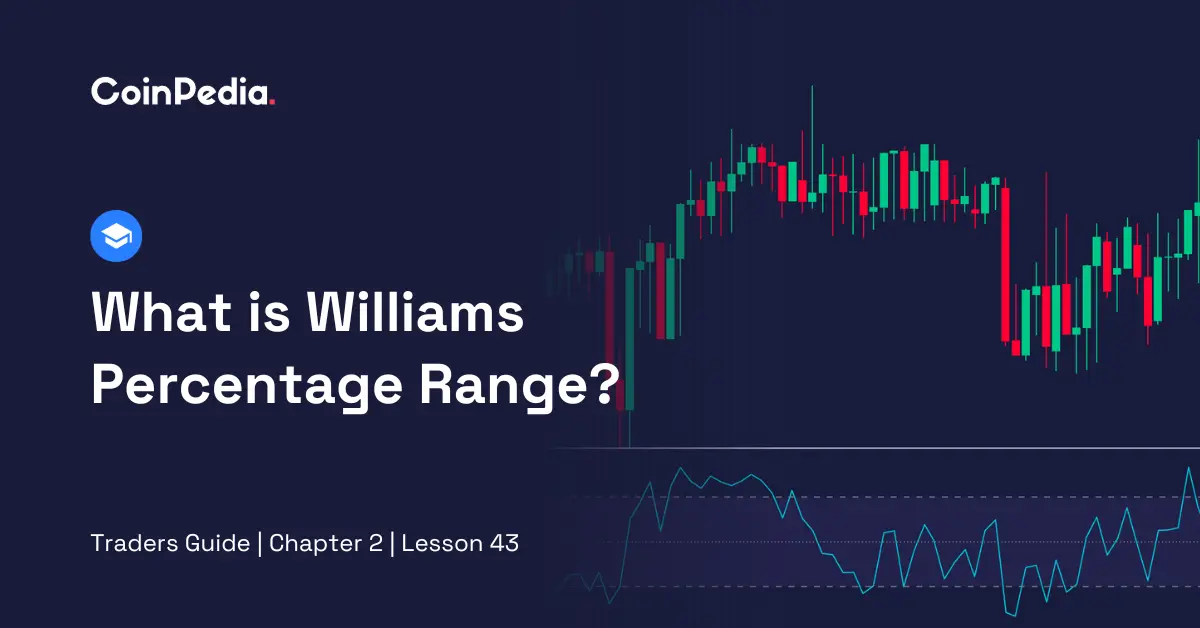
A member of the momentum indicator family, Williams %R is an effective indicator that helps crypto traders to identify potential price corrections, trend reversals and overbought or oversold levels in cryptocurrency prices.
Williams %R was created by Larry Williams. He wanted a tool to help him figure out if an asset was overbought or oversold.
Williams %R is an improved version of the Stochastic Indicator but with a different scale. Its values go from -100 to 0, where -100 means prices are potentially too low, and 0 means they might be too high.
There is a strong similarity between the formulas of stochastic indicator and Williams %R.
Here is the formula of Williams %R:
| Williams %R (WR) = [{ Highest High – Current Close } / { Highest High – Lowest Low }] * (-100) |
In simple terms, the calculation of Williams %R involves taking the difference between the Highest High and Current Close, dividing it by the difference between the Highest High and Lowest Low, and then multiplying the result by -100.
The entire process of launching Williams %R on a TradingView chart can be broken down to a few easy steps. They are:
The primary signals that we can read from the Williams %R indicator are:
If %R crosses above -50, it signals a bullish trend. If %R falls below -50, it indicates a bearish trend.
%R above -20 signals overbought conditions. %R below -80 reflects an oversold market.
If %R moves above -20 but cannot stay there, the bullish trend may be fading. If it drops below -80 but does not stay, the bearish trend might lose strength.
Let’s learn the concept of Williams %R Divergence deeper. Divergence generally happens when prices do not confirm with Williams %R. There are two types of divergence:
When prices are going up (bullish signal), but Williams %R is falling, it is a bearish divergence. This signals a potential price correction, and traders might consider opening a short position to profit from the expected downturn.
When prices are going down (bearish signal), but Williams %R is rising, it is a bullish divergence. This suggests a possible reversal in the downtrend, and traders might think about opening a buying position to benefit from the expected upward movement.
Also Read: Unlocking the Power of the Chaikin Oscillator: A Comprehensive Guide
William %R is a helpful tool for crypto traders, designed by Larry Williams to spot potential price corrections, trend reversals and overbought or oversold conditions in cryptocurrency markets. By following its signals, crypto traders can make informed decisions about buying or selling digital assets. Understanding its basics, calculation, and interpretation can improve your trading strategies and potentially enhance your success in the crypto market.
The latest supply event from Chainlink is back in focus as the network completed its…
Gold ($2.15B) and Silver ($1.98B) futures on Binance have surged to rank fourth and fifth,…
On-chain investigator ZachXBT has published a detailed investigation alleging delays or failures in USDC stablecoin…
The Ontology Gas price is rising today, becoming one of the top performers in the…
The crypto market is under pressure this week, with geopolitical tension pushing oil higher and…
BNB price has lost a key structural level at $600, triggering a shift in momentum…