In the fast-paced world of crypto trading, staying ahead of market trends is essential for success. The Rate of Change indicator is a useful tool that provides valuable insights into the pace of price movements. For that reason, it is essential for a crypto trader to learn deeply about what this indicator is. Let’s dive deep into how ROC can help crypto traders make informed trading decisions, navigate crypto price shifts and capitalise on crypto trading opportunities.
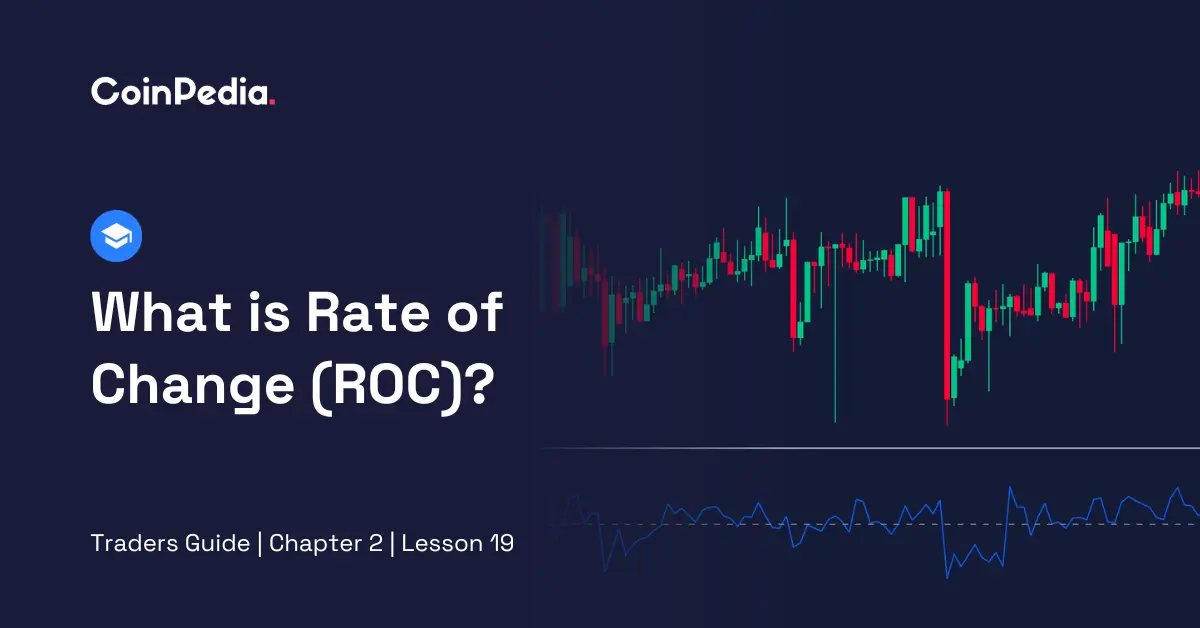
The Rate of Change indicator is a valuable technical tool used in cryptocurrency trading. It tells us the percentage by which the price of a cryptocurrency has changed over a certain time period. ROC can go above or below a central line at ‘0’. If it is above, that is seen as positive momentum, and if it is below, it is negative.
To calculate ROC follow the below given formula:
| ROC = ((Current Price – Price N Periods Ago) / Price N periods ago) * 100 |
Subtract the price of the cryptocurrency from the price N periods ago, divide the result by the price N periods ago, and then multiply by 100. This gives you the percentage change in price over that time, helping traders assess the momentum.
Primarily, ROC can give four signals:
When ROC is positive, it signals upward momentum or buying pressure, suggesting the price is likely to rise. Negative ROC indicates downward momentum or selling pressure, suggesting the price may fall.
ROC crossing above or below the zero line can indicate potential trend changes. Above zero suggests positive momentum, while below zero suggests negative momentum. These crossovers can provide early signals for trend shifts.
Traders use historical ROC values to determine overbought and oversold levels, which can vary by asset. Extreme values may indicate a potential reversal. Overbought suggests a possible price drop, while oversold may suggest a price increase.
Divergence occurs when ROC and price move in opposite directions. For example, if price rises while ROC falls, it signals bearish divergence and a potential price drop. If price falls while ROC rises, it indicates bullish divergence and a potential price increase.
ROC is a powerful indicator for crypto traders, offering insights into price momentum and potential trend changes. However, it is essential to note that ROC, like many technical indicators, is not foolproof. It may provide false signals, especially during periods of extreme volatility. Traders should use ROC in conjunction with other analysis techniques for a more comprehensive understanding of the market.
Ripple has joined BLOOM, an initiative by the Monetary Authority of Singapore aimed at improving…
Bitcoin Cash (BCH) price is beginning to shift gears, and this time, the structure suggests…
Story Highlights The live price of the UMA token is . UMA price prediction suggests…
Ripple, known for its fast cross-border payments, is now testing its RLUSD stablecoin in Singapore’s…
T. Rowe Price just filed to include Dogecoin in its $1.8 trillion actively managed crypto…
Story Highlights The live price of Flare crypto is . Price predictions for 2026 range…