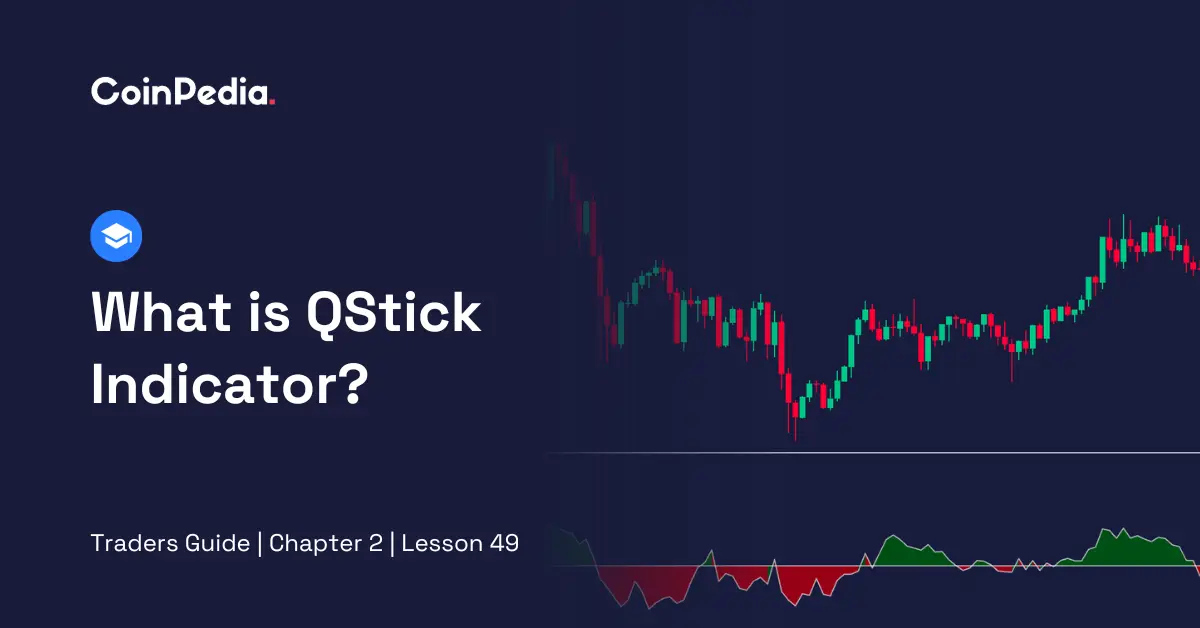
There are certain indicators that can provide amazingly accurate insights, especially when it comes to analysing trends. One such indicator is QStick. There are several specialities with this indicator that help it stand out from other trend-focused indicators. Here, the attempt is to explain this indicator in the simplest way possible to make it easy for even beginner traders to use it easily. Let’s start!
The QStick Indicator, created by Tusher Chande, is an advanced technical momentum indicator. It gives traders insights into whether an asset is generally moving up or down based on its daily price change, by examining the moving average of the difference between the closing and opening prices.
The QStick indicator is an oscillator. It appears as a line on a chart that moves above or below a central zero line. In TradingView, it appears below the price chart.
Calculating QStick is simple. Let’s learn the formula first.
| QStick = MA (Close – Open, n) |
The QStick indicator is calculated using a moving average (MA) of the difference between the closing and opening price over a specified period (n).
Let’s break down the calculation to learn it further.
Here is the step-by-step to launch QStick on a TradingView chart:
Here are the three basic signals that this indicator generally gives.
Crossing above zero signals a potential buy, and crossing below zero signals a potential sell. The former is a bullish indication and the latter one is bearish.
Look for extremes in QStick values. Reversing off an extreme high signals a potential Sell, while reversing off an extreme low signals a potential buy.
Compare QStick with the asset price. If a QStick is up but the asset price is down, it is a potential buy. If QStick is down but the asset price is up, it is a potential sell.
Also Read: Mastering Coppock Curve: A Tool for Smart Crypto Trading
The QStick indicator, devised by Tusher Chande, is a valuable tool for traders, providing insights into asset momentum. Calculated as the moving average of closing-open price differences, it appears as an oscillator on charts. To apply it on TradingView, users can follow a simple step-by-step guide. Interpretation involves signals from zero line crossings, extreme highs and lows and divergences with asset prices. This indicator aids traders in making informed decisions by discerning potential buying or selling opportunities based on market trends and extremes
Story Highlights The price of the Meme Ai token is . MEMEAI trades near $0.00005890,…
Story Highlights The live price of the Zcash token is Zcash price could see a…
Bitcoin is once again testing an important resistance zone, and traders are watching closely to…
XRP has just printed its largest on-chain realized loss spike since 2022 — and the…
There’s a lot happening in crypto right now, and one date keeps coming up: March…
After breaking above the local consolidation range near $1,950, the Ethereum price has pushed higher…