Have you ever looked at a price chart and felt completely lost? Candles going up and down, patterns forming and breaking, and you’re left wondering—what’s really happening? If that sounds familiar, you’re not alone.
Here’s the truth: the market is always talking. It leaves clues in the form of price action. But to truly understand these clues, you need the right tools. One of the simplest yet most powerful tools is Moving Averages.
Moving Averages (MAs) help traders make sense of the chaos. They smooth out price fluctuations and give you a clearer picture of trends. Think of them as a filter that removes the noise so you can see the real movement of the market.
So, let’s break it down. By the end of this guide, you’ll know exactly how to use moving averages to read price action like a pro.
Moving Averages are indicators that show the average price over a specific period. The two main types are:
For example, if you’re using a 50-day SMA, it calculates the average closing price over the last 50 days. Each new day, it drops the oldest price and adds the latest one.
The 50-day and 200-day MAs are widely used by traders to identify trends. Shorter-term MAs like the 9-day and 21-day work well for faster movements.
Moving Averages help you see the overall trend at a glance:
For example, if Bitcoin is trading above its 50-day MA, the trend is bullish (upward). If it falls below, the trend may be turning bearish.
Crossovers happen when a shorter-term MA crosses a longer-term MA. This signals a possible trend change.
Example: In 2020, Bitcoin had a Golden Cross where the 50-day MA crossed above the 200-day MA. This was followed by a strong uptrend.
Price action is the raw movement of price on a chart. By combining it with moving averages, we can get high-probability trading signals.
Moving Averages act as dynamic support and resistance levels.
Example: If Ethereum is in an uptrend and pulls back to the 50-day MA, that level may act as support, and the price could bounce higher.
For example, if the price of Tesla stock is consistently above the 200-day MA without touching it, the trend is strong.
This is for traders who want to ride the trend until it ends.
For example, if Apple’s stock price is above the 50-day MA, you could stay long until the price closes below it.
This works best in trending markets where price respects the MA.
Example: If gold is trending up and pulls back to the 200-day MA, a trader may enter a buy trade if it starts to bounce off that level.
Example: If Bitcoin’s 50-day MA crosses above the 200-day MA, traders might look for buying opportunities.
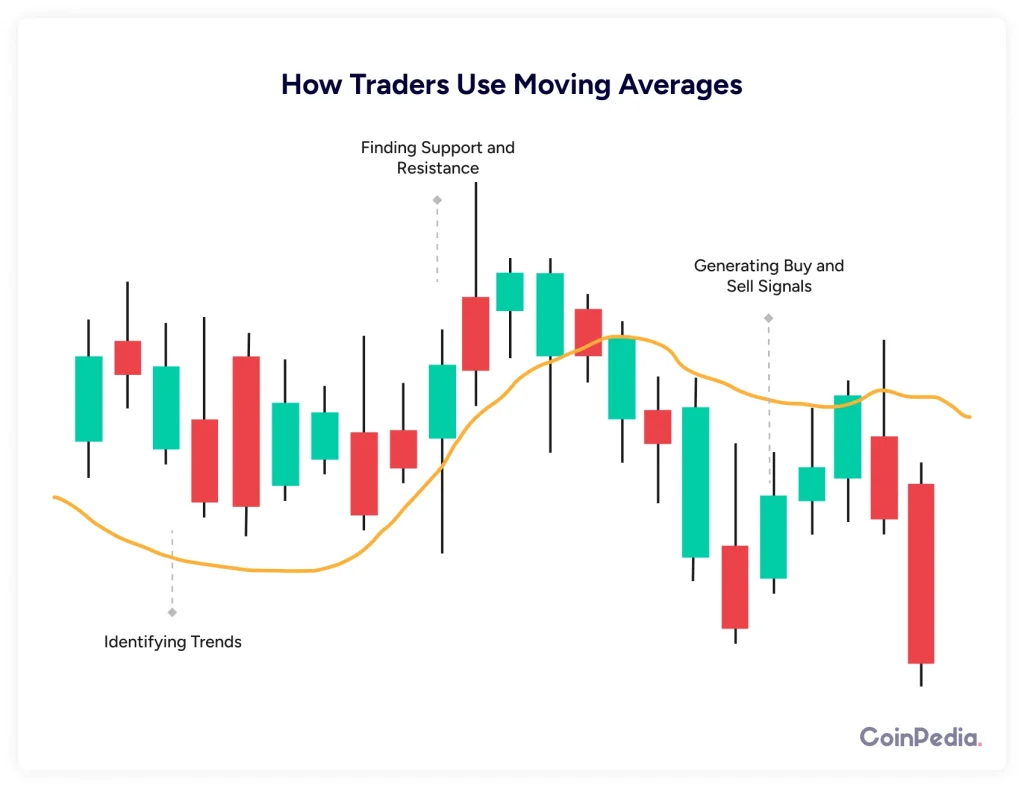
Reading price action with moving averages is like learning a new language. At first, it may seem tricky, but with practice, it becomes second nature.
Keep it simple. Look for trends, use MAs as dynamic support/resistance, and don’t rush into every signal. The market always gives opportunities—your job is to read them right.
For day trading, shorter-term moving averages like the 9-day EMA and 21-day EMA work best because they respond quickly to price changes, helping traders catch short-term trends.
Yes! Moving averages work well in crypto, but since crypto markets are more volatile, using a combination of EMAs (like 10-day and 50-day EMAs) can help smooth out price action and provide better entry points.
It depends on your trading style:
Scalpers: Use 1-minute to 5-minute charts.
Day traders: Use 15-minute to 1-hour charts.
Swing traders: Use 4-hour to daily charts.
False signals are common, especially in choppy markets. To filter them out, use additional indicators like RSI or MACD, and always confirm with price action before making a trade.
Not really. When the market is ranging (sideways), moving averages can generate a lot of false signals. It’s better to rely on support and resistance levels or momentum indicators in such conditions.
The WLD price is approaching a make-or-break zone. The weekly chart shows resistance between $0.56…
The NEAR price is pushing higher again after bouncing from $4.34 support, and bulls are…
NEAR Protocol (NEAR) & Worldcoin (WLD) prices have turned out to be among the top…
How can beginners participate in computing infrastructure and earn rewards without buying mining equipment or…
China could become a major driver of the next crypto market cycle if it finds…
Amazon (AMZN) stock climbed 3.29% on Friday, putting its next major resistance level at $280…

