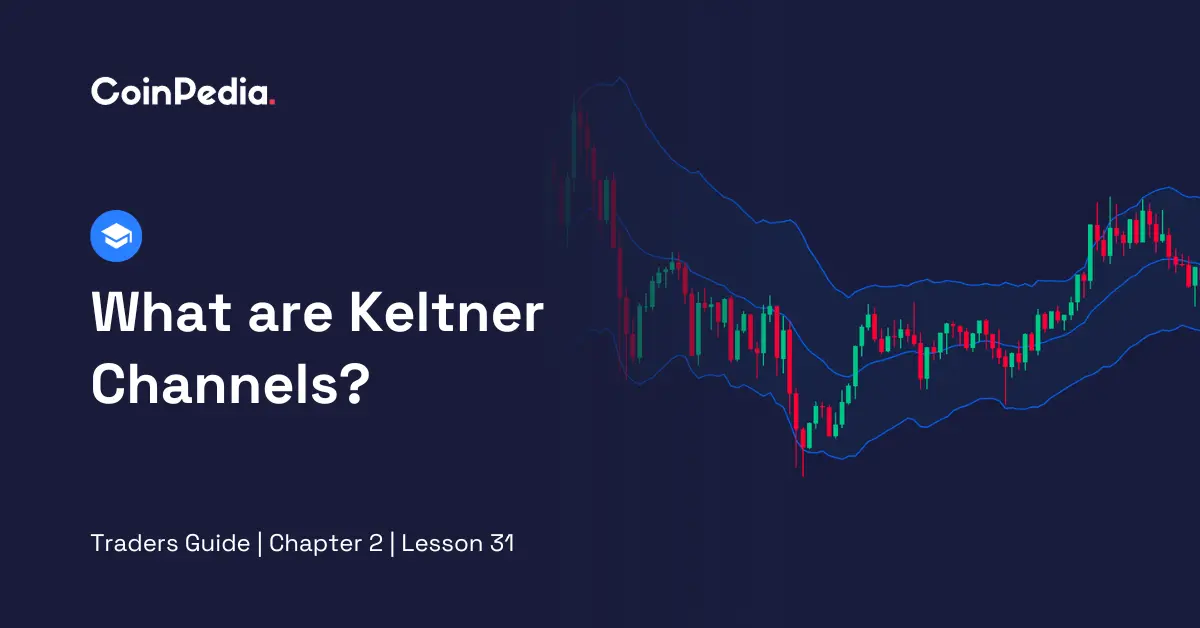
One method of creating advanced indicators is to discover the right combinations from the existing indicators. A combination of two or three simple indicators may create a powerful, advanced indicator. The Keltner Channel, based on Exponential Moving Average and Average True Range, is a prime example of such an innovation. Are you interested in learning about this indicator? Let’s discuss the basics of Keltner Channels!
Keltner Channels, similar to Bollinger Bands, are blue channels that show the average price of an asset over a period. These channels help us see if the price is moving in a trend or just staying flat.
Chester Keltner, a US grain trader, introduced the Keltner Channel indicator in the 1960s for commodities. It later expanded to stock, forex, and cryptocurrency markets.
Linda Bradford Raschke reformed it in the 1980s, switching from the Simple Moving Average to the Exponential Moving Average for more responsiveness.
The Keltner Channel indicator surrounds price movements with three lines. The middle line represents the average price trend. The upper and lower lines act as flexible boundaries, adjusting based on recent price changes and volatility.
The Keltner Channel indicator formula relies on two external indicators: EMA and ATR. These indicators are combined to create three different calculations for the middle, upper and lower envelopes of Keltner Channel.
| Middle Envelope: EMA (Exponential Moving Average |
The Middle line is calculated using the EMA, which shows the average price over time.
| Upper Envelope: EMA + (ATR * User-Defined Multiplier) |
To find the upper line, you add the product of the ATR and a factor chosen by the user to the EMA.
| Lower Envelope: EMA – (ATR * User-Defined Multiplier) |
The lower line is calculated by subtracting the product of ATR and user-defined factor from the EMA.
Here are the steps to launch the Keltner Channel on a TradingView Chart:
The basic signals Keltner Channel provides are:
When the price moves outside the channel, it signals a potential trend change.
If the price touches the upper channel, it could be overbought; if it touches the lower channel, it may be oversold.
When the channel narrows, it suggests low volatility, possibly leading to a big price move.
Also Read: Analysing Cryptocurrency Trends: Heikin Ashi Explained
Keltner Channels offer traders valuable insights into price trends. Developed by Chester Keltner for commodities, it later found use in various markets, with Linda Brandford Raschke enhancing it. The indicator helps traders identify trends and potential reversals by surrounding price movements with flexible boundaries. Calculated using Exponential Moving Averages and Average True Range, it is a versatile tool. By following simple steps, traders can easily apply it on TradingView for effective analysis and decision-making.
Popular cryptos, NEAR Protocol (NEAR) & LayerZero (ZRO), are drawing attention after their recent rallies,…
Bitcoin entered October 2026 with three consecutive green months and a 6.33% September gain, the…
Bull Theory warns that the upcoming US midterm elections could increase uncertainty for AI stocks,…
Ripple-backed Evernorth is making its Nasdaq debut today under the ticker XRPN, bringing 473 million…
Bitmine Immersion Technologies (NYSE: BMNR) reported total holdings of $16.2 billion as of October 11,…
Bitcoin’s supply is approaching its 21 million cap, but how much of it is actually…
