Reducing unnecessary noise from our charts can assist us in making better trading decisions. There are several methods to achieve this, with one of the most effective ones being Heikin Ashi. Let’s delve into everything you need to know about it. Are you ready?
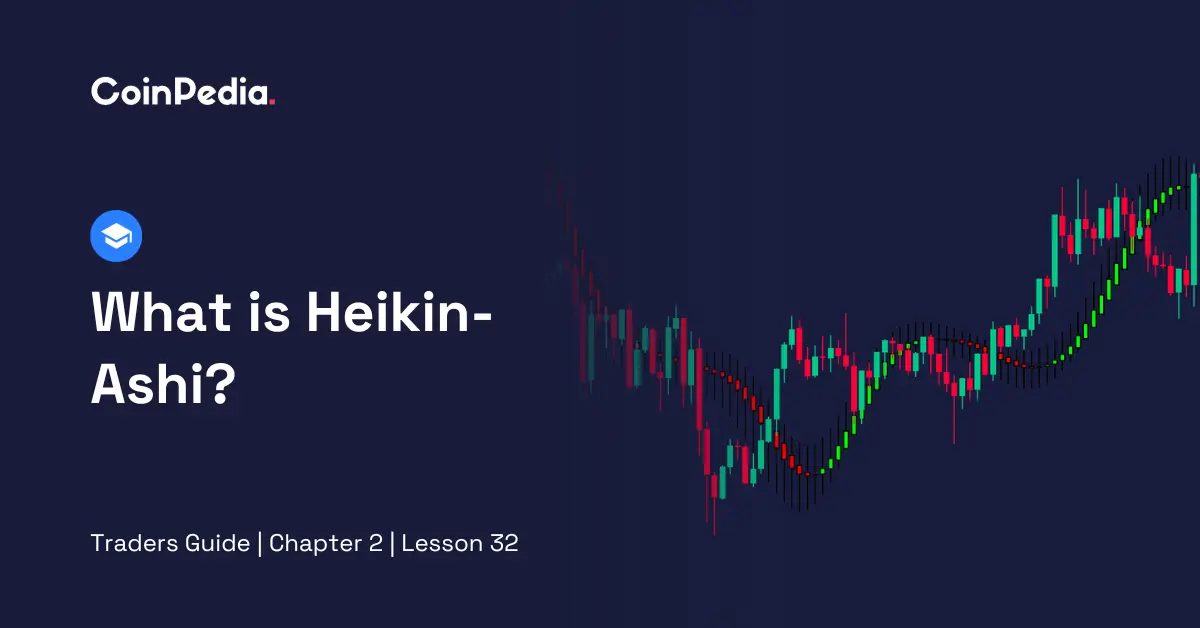
Heikin Ashi is a special type of chart used in crypto trading. A Heikin Ashi chart appears as a modified version of a normal chart. The goal of Heikin Ashi charts is to make it easier to see the main trend of a price movement by reducing the noisy ups and downs. It does this by using a unique method to calculate the opening, high, low and closing prices of each period.
Let’s understand how to calculate Heikin Ashi.
| HA Close = (High + Low + Open + Close) / 4 |
The Heikin Ashi close is the average of the actual high, low, open and close prices for the given time period
| HA High = (Prior HA Open + Prior HA Close) / 2 |
The HA open is the average of the open and close prices of the previous Heikin Ashi candle.
| HA High = Maximum of (Current High, Current HA Open, Current HA Close) |
The HA high is determined by selecting the highest value among the current high price, the current Heikin Ashi open price, and the current Heikin Ashi close price.
| HA Low = Minimum of (Current Low, Current HA Open, Current HA Close) |
The HA low is founded by choosing the lowest value among the current low price, the current HA open price, and the current Heikin Ashi close price.
Here are the step-by-step instructions for launching a Heikin Ashi chart on TradingView:
The basic signals that we can read from Heikin Ashi charts are:
Look for consecutive green Heikin Ashi candles, which indicate an uptrend. Consecutive red candles signal a downtrend.
In a strong trend, green candles typically have no lower wicks, and red candles have no upper wicks.
When you see both upper and lower wicks, it suggests the trend is losing momentum, indicating a potential weakening of the trend’s strength.
Pay attention to changes in candle colour. A shift from green to red (or vice versa), especially when accompanied by small-bodied candles and long wicks, may indicate a possible trend reversal.
Also Read: Keltner Channels: Your Roadmap to Price Trends in Crypto Trading
Heikin Ashi charts offer a valuable tool for crypto traders in the crypto market, aiding in trend identification, assessing trend strength, and detecting potential reversals. By understanding how to calculate Heikin Ashi candlesticks and utilising TradingView to assess these charts, investors can gain insights into market movements with reduced noise. These basics of Heikin Ashi analysis provide a foundation for making informed trading decisions in the dynamic world of cryptocurrency.
CoinPedia has been delivering accurate and timely cryptocurrency and blockchain updates since 2017. All content is created by our expert panel of analysts and journalists, following strict Editorial Guidelines based on E-E-A-T (Experience, Expertise, Authoritativeness, Trustworthiness). Every article is fact-checked against reputable sources to ensure accuracy, transparency, and reliability. Our review policy guarantees unbiased evaluations when recommending exchanges, platforms, or tools. We strive to provide timely updates about everything crypto & blockchain, right from startups to industry majors.
All opinions and insights shared represent the author's own views on current market conditions. Please do your own research before making investment decisions. Neither the writer nor the publication assumes responsibility for your financial choices.
Sponsored content and affiliate links may appear on our site. Advertisements are marked clearly, and our editorial content remains entirely independent from our ad partners.
AI systems are beginning to move beyond generating text or code and into performing actions.…
After months of stalemate, the crypto market news today shifted on April 3 when reports…
The Pepe price has been stuck within a strong descending trend since the start of…
Bitcoin has climbed back above the $70,000 mark, hitting its highest level in the past…
Story Highlight XRP price holds near $1.30 despite a 60% drop from 2025 highs XRPL…
As broader crypto market conditions begin to stabilize, SUI is quietly shifting its structure, showing…