Fibonacci is a very famous name in crypto trading. Fibonacci Retracemnt is a very famous tool used by professional crypto traders. The tool is known for its uniqueness, because it is built using a mysterious calculation discovered centuries ago. Do you know that this indicator is not the only tool that uses this calculation. Fibonacci Extension is also built using the same calculation, and follows the same principle of retracement as well. Let’s learn how this valuable tool can assist in crypto trading.
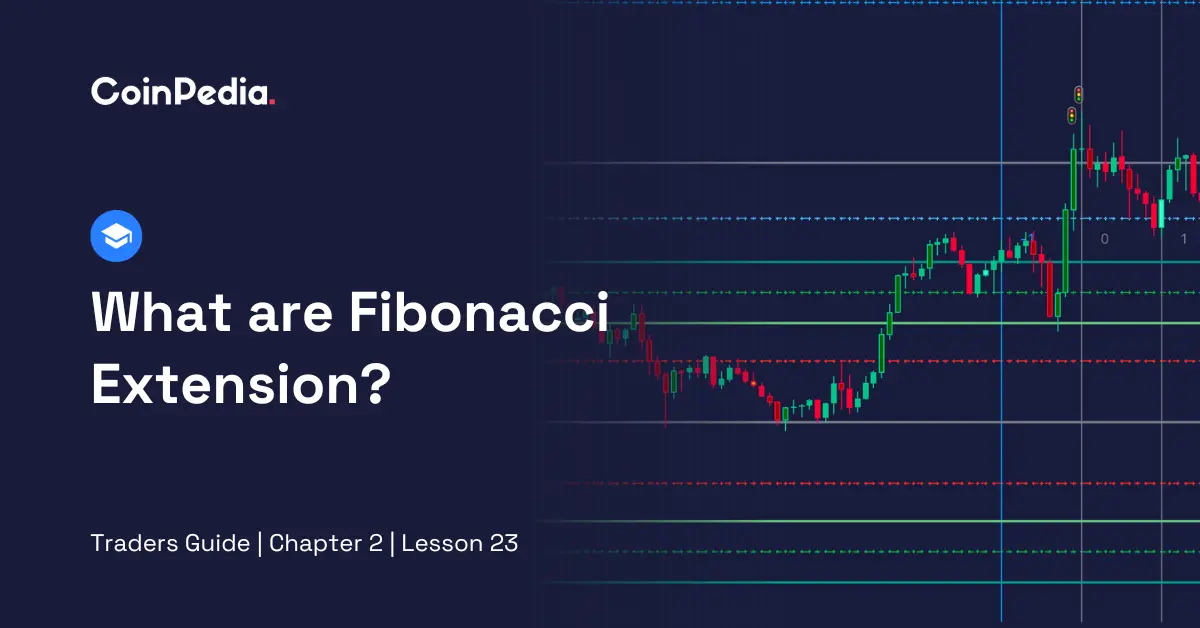
Fibonacci Extension is a valuable tool in crypto trading that helps traders predict potential price targets and reversal zones. It is based on Fibonacci Ratios, such as 61.8%, 100%, 161.8%, 200%, and 261.8%, represented as lines on a price chart.
The Fibonacci levels assist traders in estimating how far a price may move after a temporary pullback. For instance, if a cryptocurrency’s price drops, Fibonacci Extension can help identify where it might rise to the next.
Fibonacci Extension plays a pivotal role in crypto trading by offering valuable signals.
When a cryptocurrency’s price dips, Fibonacci Extension applies specific ratios (like 61.8%, 100%, etc.) to calculate where it might bounce back. For example, if a crypto’s value drops to the 61.8% level, it means it could potentially recover about 61.8% of its previous high. This provides traders with specific levels to aim for when setting buy or sell orders.
The indicator identifies these zones using Fibonacci Ratios. For instance, during an upward trend, it identifies points (like 161.8%) where the trend might stall, indicating a possible shift to a downtrend. Recognising these levels helps traders decide when it is a good time to buy or sell.
While Fibonacci Extension is a powerful tool and has many fans, it has its limitations like any indicator. It does provide insights into potential price targets and reversal zones, but it is not foolproof, and market conditions can change unexpectedly. So, better it is to use it as part of a broader trading strategy.
CoinPedia has been delivering accurate and timely cryptocurrency and blockchain updates since 2017. All content is created by our expert panel of analysts and journalists, following strict Editorial Guidelines based on E-E-A-T (Experience, Expertise, Authoritativeness, Trustworthiness). Every article is fact-checked against reputable sources to ensure accuracy, transparency, and reliability. Our review policy guarantees unbiased evaluations when recommending exchanges, platforms, or tools. We strive to provide timely updates about everything crypto & blockchain, right from startups to industry majors.
All opinions and insights shared represent the author's own views on current market conditions. Please do your own research before making investment decisions. Neither the writer nor the publication assumes responsibility for your financial choices.
Sponsored content and affiliate links may appear on our site. Advertisements are marked clearly, and our editorial content remains entirely independent from our ad partners.
Crypto in the last 24 hours just got a jolt that changes everything. Japan's cabinet…
Justin Sun says World Liberty Financial secretly built a backdoor into its smart contract that…
A post from pioneer Daniel F is generating discussion in the Pi community, and the…
The events unfolding in the Strait of Hormuz are not just a geopolitical story. According…
Crypto markets slipped on Friday after Vice President JD Vance confirmed that direct US-Iran negotiations…
Right now, Chainlink price is hovering in a well-defined range, with support sitting around $8…