Filtering out short-term price trends in crypto trading is crucial for clarity and wise decision-making. It reduces emotional reactions, aids in risk management, supports long-term strategies, and helps traders focus on fundamental factors and significant trends while avoiding costly overtrading. The best indicator that can be used to filter out short-term price trends is Detrended Price Oscillator. Let’s know more about this oscillator in detail. Are you ready? Let’s start.
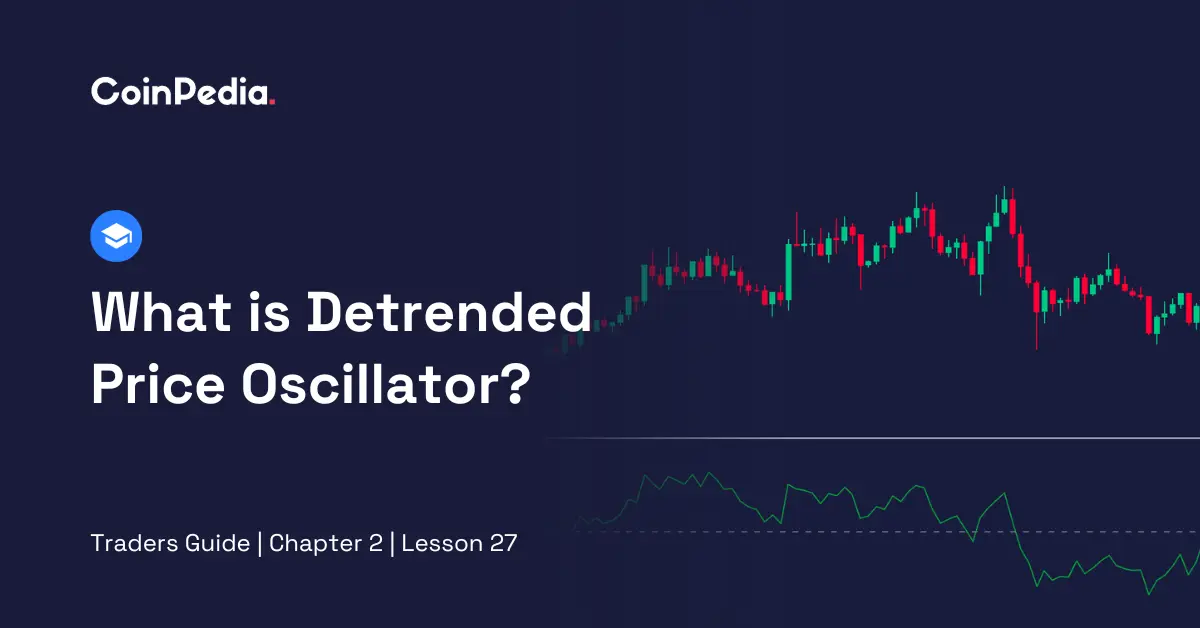
The Detrended Price Oscillator, or DPO, is a powerful tool for crypto trading. It helps cryptocurrency traders see the bigger picture by taking out the short-term ups and downs in prices. It is a way to focus on what really matters in the price movements.
The Detrended Price Oscillator works by removing short-term price trends from an asset’s historical price data. It calculates the difference between a past price and a moving average, which smooths out daily ups and downs. This reveals the longer-term cycles and patterns hidden beneath the noise.
Calculating Detrended Price Oscillator is simple.
| DPO = Price (X/2 + 1) – X-Period Simple Moving Average |
Let’s break down the DPO calculation into five parts:
Here are the steps to launch the Detrended Price Oscillator on a TradingView chart:
Generally, the Detrended Price Oscillator can give three signals:
When DPO swings to extreme high or low values, it may signal overbought or oversold market conditions.
If DPO is very high, consider selling. If it is very low, think about buying.
Look for situations where DPO moves in the opposite direction of price trends.
If DPO goes up while price go down, it is a bullish signal – think about buying. If DPO goes down while prices go up, it is a bearish signal – consider selling.
When DPO crosses above or below zero, it can indicate potential trend changes.
DPO above zero suggests a bullish trend; below zero implies a bearish trend.
Also Read: Trading for Beginners: How to Use the McClellan Oscillator in Crypto
The Detrended Price Oscillator is a highly valuable tool for cryptocurrency traders. It helps traders focus on the bigger picture by filtering out short-term price noise. With a simple calculation and easy integration into trading platforms like TradingView, it provides essential insights. DPO signals, such as divergence and crossovers, offer clear guidance for trading decisions. Definitely, by understanding DPO, crypto traders can enhance their trading strategies. Anyway, like other crypto trading indicators, this is also not foolproof. So, it is always better to use this indicator in conjunction with other indicators.
CoinPedia has been delivering accurate and timely cryptocurrency and blockchain updates since 2017. All content is created by our expert panel of analysts and journalists, following strict Editorial Guidelines based on E-E-A-T (Experience, Expertise, Authoritativeness, Trustworthiness). Every article is fact-checked against reputable sources to ensure accuracy, transparency, and reliability. Our review policy guarantees unbiased evaluations when recommending exchanges, platforms, or tools. We strive to provide timely updates about everything crypto & blockchain, right from startups to industry majors.
All opinions and insights shared represent the author's own views on current market conditions. Please do your own research before making investment decisions. Neither the writer nor the publication assumes responsibility for your financial choices.
Sponsored content and affiliate links may appear on our site. Advertisements are marked clearly, and our editorial content remains entirely independent from our ad partners.
Crypto is moving into regulated portfolios, including U.S. retirement plans. That shift matters less for…
In another blow to the decentralized finance giant, Chaos Labs has announced it will step…
Story Highlights The live price of the ARB token is . Price predictions for 2026…
TAO price showed a sharp 10% intraday surge pushed it cleanly off a key level…
XRP price has been stuck within a strong descending trend for the past 8 months,…
Bitcoin investors hoping for a quick recovery may need to be patient. That is the…