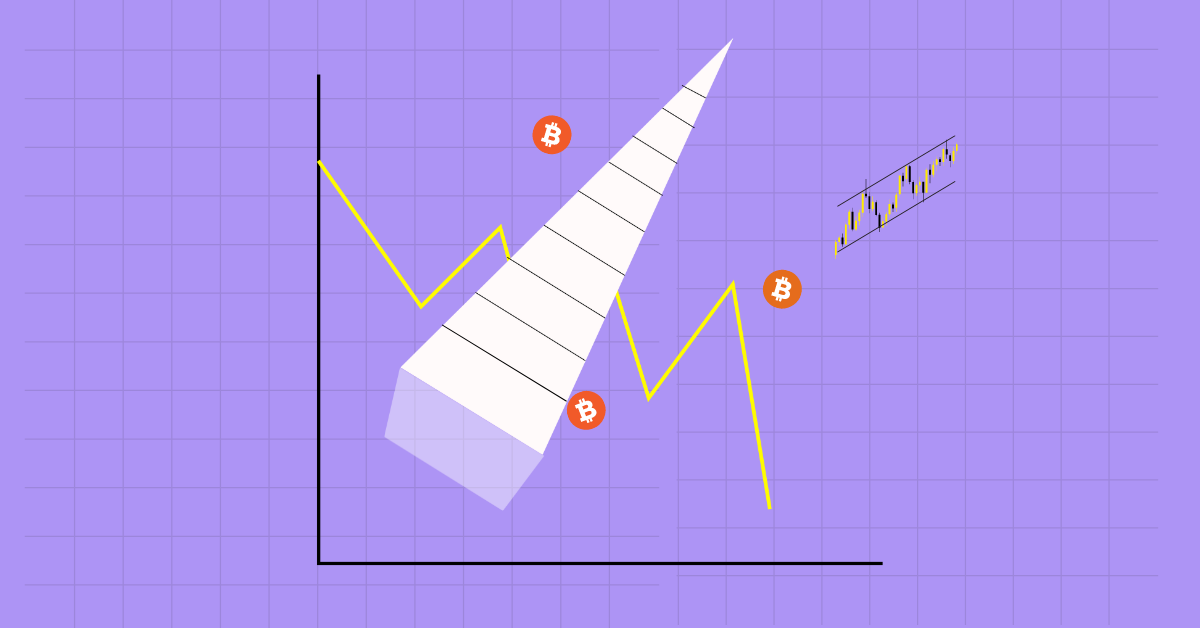
If you’ve been trading for a while, you’ve probably come across wedge patterns. If not, you’re in for a treat because wedge patterns can be incredibly powerful when spotting potential market moves.
Now, don’t let the term “wedge” confuse you. It’s not something fancy or complicated. In fact, once you understand it, it becomes one of the simplest yet most effective tools in a trader’s arsenal. Whether you’re trading stocks, crypto, forex, or commodities, wedge patterns can help you make better decisions.
So, let’s break it down step by step. We’ll cover what wedge patterns are, how they work, how to spot them, and, most importantly, how to trade them effectively.
A wedge pattern is a technical analysis pattern that shows price moving within two converging trend lines. It looks like a triangle that’s either sloping upward (rising wedge) or downward (falling wedge). These patterns indicate that the market is getting squeezed, and a breakout is coming soon.
Think of it like a spring being compressed. The price is bouncing between these two lines, and at some point, it’s going to snap in one direction or the other. That’s where traders can catch great opportunities.
There are two main types:
Let’s go deeper into each one.
A rising wedge happens when the price is moving up, but the trend lines are narrowing. The highs and lows are getting closer together, showing that buying pressure is weakening. Eventually, the price breaks down, leading to a bearish move.
A rising wedge forms when buyers are pushing the price up, but their strength is fading. Think of it as a car running out of fuel while climbing a hill. At some point, it slows down and starts rolling backward. That’s exactly what happens in a rising wedge—momentum weakens, and eventually, sellers take control.
Imagine Bitcoin is climbing from $40,000 to $45,000, forming a rising wedge. Each push higher becomes smaller, and eventually, Bitcoin breaks down to $38,000. That’s a classic rising wedge breakdown.
A falling wedge is the opposite of a rising wedge. The price is moving down, but the lows and highs are getting closer. This signals that selling pressure is fading, and a breakout to the upside is likely.
A falling wedge forms when sellers are dominating, but they’re losing strength. Think of it like a heavy object rolling downhill but slowly losing speed. Eventually, it stops and starts moving back up. In trading, this is where buyers step in and push the price higher.
Ethereum drops from $3,000 to $2,500, forming a falling wedge. Sellers are getting exhausted, and suddenly, Ethereum breaks out and climbs back to $3,200. That’s a perfect falling wedge breakout.
Even though wedge patterns are simple, traders often make mistakes when using them. Here are some pitfalls to avoid:
Wedge patterns are a fantastic tool for traders, but like all strategies, they require practice. The more you spot them in real markets, the better you’ll get at trading them.
Now that you know how to use wedge patterns, keep an eye on your charts and start identifying them in real time. The next time you see a wedge forming, you’ll know exactly what to do!
Also read: Wyckoff Method Revealed: Craft Your Crypto Success Story Today
No pattern is 100% reliable. However, wedge patterns work well when combined with other indicators like volume, RSI, or moving averages.
It depends on the timeframe. In shorter timeframes (minutes/hours), it may resolve quickly. In longer timeframes (days/weeks), it can take more time.
Yes, but it’s rare. If it does, it usually happens in strong bullish trends.
Wedge patterns work on all timeframes, but higher timeframes (4-hour, daily) tend to produce stronger signals.
Absolutely! Wedge patterns work across all markets, including stocks, forex, and crypto.
Bitmine Immersion Technologies shareholders have now accumulated approximately $8.8 billion in paper losses on Ethereum,…
XRP is once again making headlines. After briefly rallying to $1.46 over the weekend, the…
The Ethereum price has bounced back above $1,900 after a sharp drop, but the bigger…
Michael Saylor’s company "Strategy" continues its aggressive Bitcoin acquisition, adding 592 BTC for around 39.8…
While major cryptocurrencies struggle under renewed selling pressure, Toncoin is showing relative strength. The token…
SwanDesk CEO Jacob King, a well-known Bitcoin critic, says companies are rushing to dump their…