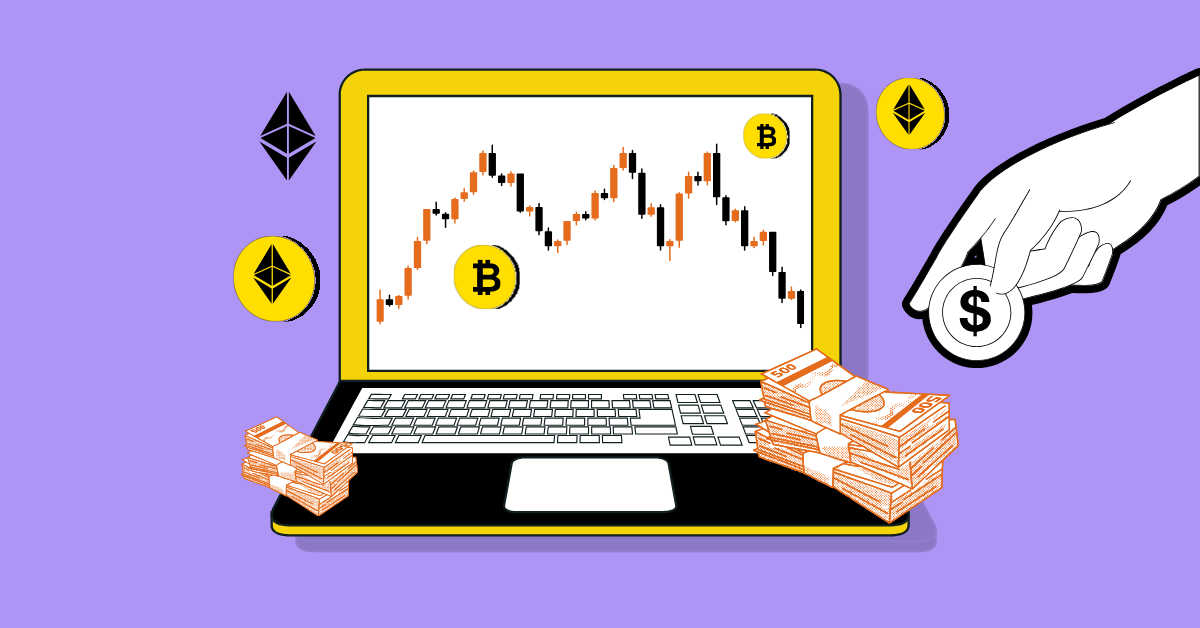
Have you ever looked at a stock or crypto chart and felt like you were staring at a foreign language? All those lines, bars, and colors—what do they even mean?
Well, here’s the good news: The secret to understanding price movements lies in something called price action. And once you grasp it, trading will make a lot more sense.
In this guide, we’ll break down price action, candlestick patterns, and how you can use them to make better trading decisions. So, grab a coffee and let’s dive in!
Price action is simply the movement of a security’s price over time. It’s what you see on a chart—the ups, the downs, and everything in between.
Traders use price action to analyze and predict future price movements without relying on indicators like RSI, MACD, or moving averages. Instead, they focus purely on how price behaves.
Think of it like reading body language. If someone is smiling, they’re probably happy. If a stock is making higher highs and higher lows, it’s probably in an uptrend.
Price action is based on supply and demand. When buyers are in control, prices go up. When sellers dominate, prices fall.
To get a better grasp, let’s break it down further:
Example: If Bitcoin keeps bouncing off $30,000 and never goes lower, that level acts as support. If it struggles to break above $40,000, that’s resistance.
Price action can be used in multiple ways, but here are three common strategies:
If you see an uptrend, you buy on pullbacks (when price dips slightly). If it’s a downtrend, you sell on rallies (when price spikes up slightly).
Wait for the price to break above resistance or below support, then enter a trade with strong momentum.
Look for signs that a trend is ending. For example, if an uptrend starts forming lower highs, it might be losing strength.
Price action is powerful, but it’s not foolproof. Here’s why:
This is why experienced traders combine price action with other tools like volume analysis, market sentiment, and news events to make smarter trades.
Candlestick patterns are a visual representation of price action. They tell you how the price moved within a specific time frame (1 minute, 1 hour, 1 day, etc.).
A candlestick consists of:
When you look at candlestick charts, you’re seeing the battle between buyers and sellers play out in real-time.
Some candlestick patterns can help you spot trend reversals or continuations. Here are a few:
Hammer
Engulfing (Bullish)
Morning Star
Shooting Star
Engulfing (Bearish)
Evening Star
Trading is all about understanding price movements. Price action and candlestick patterns are among the most powerful tools to do that.
To summarize:
Now that you have this knowledge, go and look at some charts. Try spotting trends, support, resistance, and candlestick patterns. The more you practice, the better you’ll get!
Yes! Price action works for stocks, crypto, forex, commodities—basically, any market where price moves. Since it’s based on human psychology and market behavior, it applies universally.
There’s no fixed timeline. Some traders grasp it in a few months, while others take years to refine their skills. The key is consistent practice, reviewing past trades, and continuously learning.
It depends on your trading style.
Day traders use lower timeframes (5-minute, 15-minute).
Swing traders prefer 4-hour or daily charts.
Long-term investors focus on weekly or monthly charts.
Yes, though candlestick patterns make it easier to interpret. Price action traders also look at trend structure, support/resistance levels, and volume to make decisions.
Neither is inherently better—it depends on the trader. Some prefer a pure price action approach, while others combine it with indicators like moving averages or RSI for extra confirmation.
Cosmos (ATOM) is pressing against a key resistance zone that could determine its next major…
Hong Kong stocks fell on October 9 as rising oil prices, Middle East tensions and…
Thailand has approved rules allowing spot Bitcoin and Ether ETFs to trade on the Stock…
Crude oil prices fell on October 9, 2026, after US President Donald Trump said Washington…
Tata Consultancy Services (TCS) shares has surged 6.2% on October 9, 2026, after the company…
Analyst Timothy Peterson says he expects Bitcoin to set a new all-time high within 90…


