Have you ever watched a stock or crypto chart and felt like it was speaking a secret language? Well, you’re not alone. Patterns in charts tell stories about what’s happening in the market. And if you learn to read them, they can give you a serious edge in trading.
Today, we’re diving into two of the most powerful patterns: Ascending and Descending Triangles. These formations can help traders predict where the market is headed next. Whether you’re new to trading or looking to refine your skills, understanding these patterns is a must.
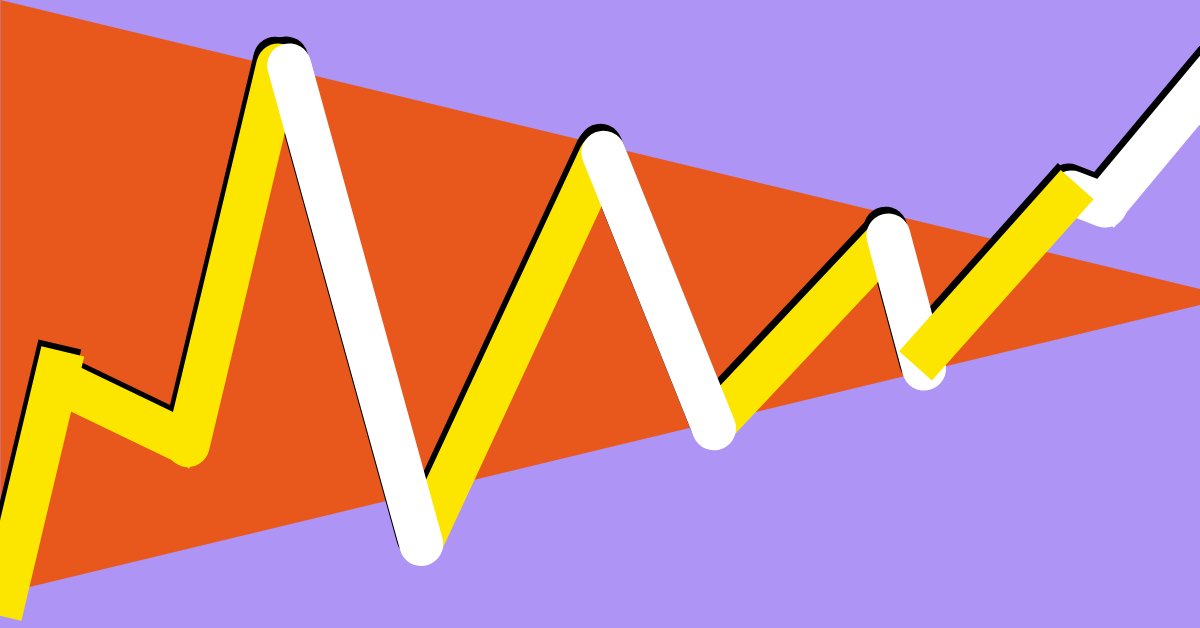
Imagine price movements drawing shapes on your chart. Triangles are one of the most common patterns, and they usually signal a breakout is coming.
Both patterns suggest that the market is gearing up for a breakout. The key is knowing which way it’s likely to go and how to trade it.
Think of an ascending triangle like a rising staircase hitting a ceiling. The price keeps knocking on that ceiling (resistance level), and each time, it comes back down—but not as low as before.
Here’s what you’ll see:
An ascending triangle suggests that buyers are gaining momentum. Even though the price keeps hitting resistance, it doesn’t fall as far each time. This means demand is increasing, and eventually, the buyers may have enough strength to break through the resistance.
Let’s say Bitcoin is trading in an ascending triangle. The resistance is at $50,000, but each dip goes higher—$45,000, then $46,500, then $48,000. Eventually, the price breaks above $50,000 with a surge in volume. This confirms the breakout, and traders jump in, expecting a rally to around $55,000 (if the triangle’s height is $5,000).
Now, flip the ascending triangle upside down. Instead of knocking on a ceiling, the price is bouncing off a floor—but each time, it falls from a lower high.
Here’s what you’ll see:
A descending triangle suggests that sellers are in control. Even though the price keeps bouncing off support, the sellers are pushing it lower each time. This weakens the support level, and eventually, it might break.
Imagine Ethereum is forming a descending triangle with support at $2,500. The highs keep getting lower—$3,200, then $3,000, then $2,800. Finally, the price breaks below $2,500, signaling a potential drop to around $2,000 if the triangle’s height was $500.
An ascending triangle is a bullish pattern, typically signaling an uptrend, while a descending triangle is bearish, indicating a potential downtrend. In an ascending triangle, the resistance level remains flat at the top, but the price forms higher lows at the bottom, showing strong buying pressure.
In contrast, a descending triangle has a flat support level at the bottom while lower highs form at the top, suggesting increasing selling pressure.
The breakout direction of an ascending triangle is usually upwards, whereas in a descending triangle, it tends to break downward. Recognizing these differences can help traders make informed decisions and position themselves accordingly.
Ascending and descending triangles are powerful tools in a trader’s arsenal. They give you a structured way to anticipate breakouts and manage risk. By combining these patterns with volume analysis and proper risk management, you can increase your chances of making profitable trades.
Next time you see a chart, look out for these triangles. They might just give you the edge you need to make smarter, more confident trading decisions.
Also read: Trading vs Investing: What’s the Difference and What’s Right for You?
An ascending triangle is a bullish chart pattern with a flat resistance level and higher lows, signaling an upward breakout when buyers gain strength.
Trade a descending triangle by waiting for a breakdown below support with high volume, entering short, setting a stop-loss above the last lower high.
Not always. False breakouts can occur, so traders confirm with volume analysis and other indicators before entering trades.
Litecoin isn’t the market favorite it once was. Since the beginning of the year, the…
XRP is once again at the center of market discussions after new commentary from analysts…
The price of XRP is currently trading near $1.46, and some analysts say an important…
Hyperliquid has launched the Hyperliquid Policy Center (HPC), a nonprofit research and advocacy group based…
Chainlink price is once again trading at a critical turning point. After losing most of…
Ever since the Bitcoin price slipped below the psychological $100,000 mark, sentiment across the crypto…