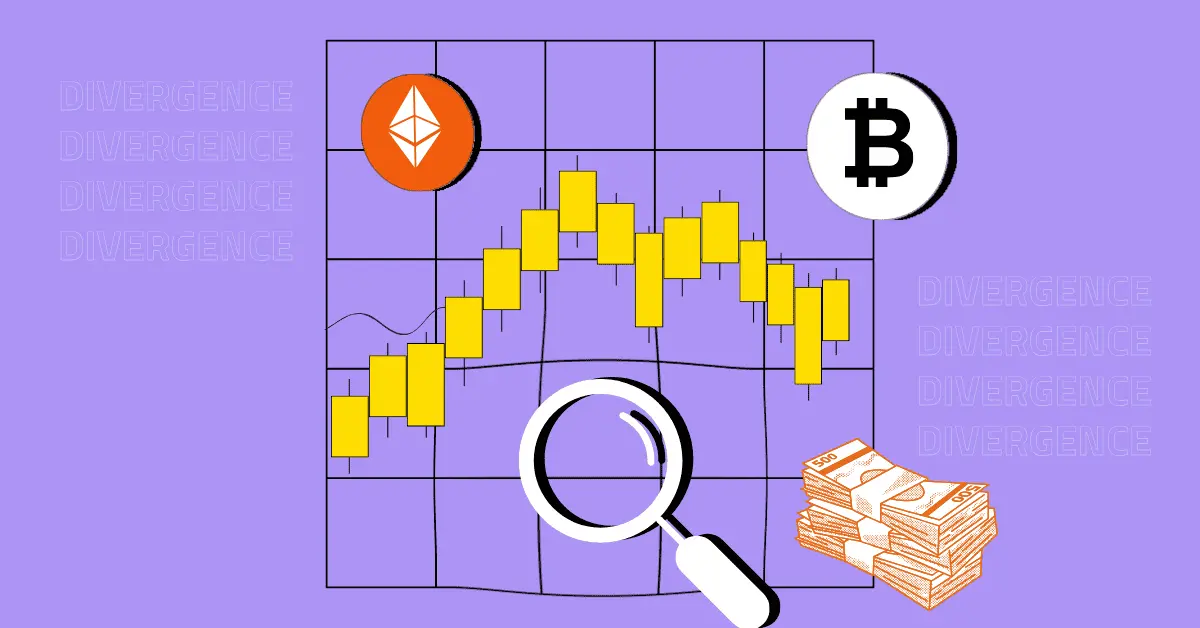
When a trader spots a difference between a cryptocurrency’s price action and a technical indicator, it is crucial to take note, as it could signal a potential trading opportunity. This difference is termed as divergence in crypto trading, and there are two types of divergence: bearish and bullish. Bearish divergence suggests a potential downward trend, while bullish divergence indicates a possible upward movement. Now, let’s dive into understanding how to navigate and make excellent trading decisions based on these divergences in cryptocurrency trading. Ready?
Any discussion about divergence in crypto should start with exploring the concept of price momentum.
Price momentum signifies the speed and strength of a cryptocurrency’s price movement. Traders analyse the direction and intensity of price changes, focusing on the length of short-term price swings to measure momentum. Strong momentum is characterised by steep slopes and long swings, while weak momentum shows shallow slopes and short swings.
Traders usually use indicators to analyse momentum. These indicators enable a clearer comparison of indicator swings to price swings.
Momentum indicators, like the Relative Strength Index (RSI), Stochastics, and Rate of Change (ROC), are technical analysis tools which assist crypto traders in quantifying the strength and speed of a crypto’s price changes. For instance, RSI measures overbought or oversold conditions, Stochastics identifies potential trend reversals, and ROC measures the percentage change in price over a specified period.
Divergence in crypto trading occurs when the price of a cryptocurrency moves opposite to a momentum indicator. The divergence naturally suggests a potential shift in market momentum, and often hints at an upcoming price retracement.
In simpler terms, the divergence is a heads-up that the crypto’s current momentum might be fading, opening a window for traders to anticipate and adapt to potential market changes.
Divergence in crypto trading comes in three main types: bullish, bearish and hidden.
Also read: Rectangle Patterns Decoded: A Must-Have Tool for Crypto Price Action Traders
Identifying price action divergence, whether bullish or bearish, involves a step-by-step process.
This signals a potential reversal as the downward momentum weakens, suggesting an upcoming upward shift.
Also Read: How to Trade Cryptocurrencies? A Step-by-Step Guide to Buying and Selling Crypto
Here are the five prime strategies to trade analysing Price Action Divergence:
Implement trendlines to validate price action divergence. Draw trendlines connecting successive highs or lows in price movements. Confirm divergence by ensuring the trendlines align with the direction indicated by the divergence, reinforcing the reliability of the trading signal.
Employ multiple time frames for a comprehensive view of price action divergence. Identify divergence on both shorter and longer time frames to strengthen the reliability of signals. This strategy helps traders avoid false signals and enhances the overall accuracy of divergence-based trading decisions.
Merge divergence analysis with support and resistance levels for robust trading strategies. When divergence aligns with key support or resistance zones, it adds confirmation to potential trend reversals or continuations, providing traders with well-rounded insights for more effective decision-making in crypto trading.
Incorporate volume analysis to validate price action divergence. Confirm divergence signals by observing corresponding changes in trading volume. An increase in volume during a divergence enhances the signal’s reliability, indicating stronger market sentiment and increasing the probability of a successful trade. This strategy helps traders make more informed decisions by considering both price action and trading volume dynamics.
Use the MACD indicator to identify crossovers as a confirmation tool for divergence signals. When the MACD line crosses above the signal line after a bullish divergence or below the signal line following a bearish divergence, it reinforces the potential strength of the reversal or continuation indicated by the divergence.
Also Read: Price Action Divergence: A Crypto Trading Masterclass To Spot The Best Trading Opportunity
Mastering the art of analysing price action divergence in cryptocurrency trading requires a nuanced understanding of price momentum and effective use of momentum indicators like RSI, Stochastics and ROC. Divergence, whether bullish, bearish, or hidden, serves as a crucial indicator for potential market shifts. The article outlines a step-by-step process for identifying divergence and presents five key strategies for trading based on these signals. By incorporating trendlines, multiple time frame analysis, support/resistance levels, volume confirmation, and MACD crossovers, crypto traders can enhance the reliability of their divergence-based decisions. With careful application of these strategies, cryptocurrency traders can navigate the dynamic market landscape with greater precision and confidence.
Story Highlights The live price of the XRP is . XRP holds a strong demand…
The XRP Ledger has been running without interruption since 2012. It has processed over 100…
One of the largest single-day options expiries of the year is hitting markets on Friday,…
The CLARITY Act, America's biggest attempt at crypto regulation, is inching toward the finish line.…
Six months ago, getting into the top 10% of XRP holders would have cost you…
A year ago, US banks thought they had won. The GENIUS Act, signed in July…
