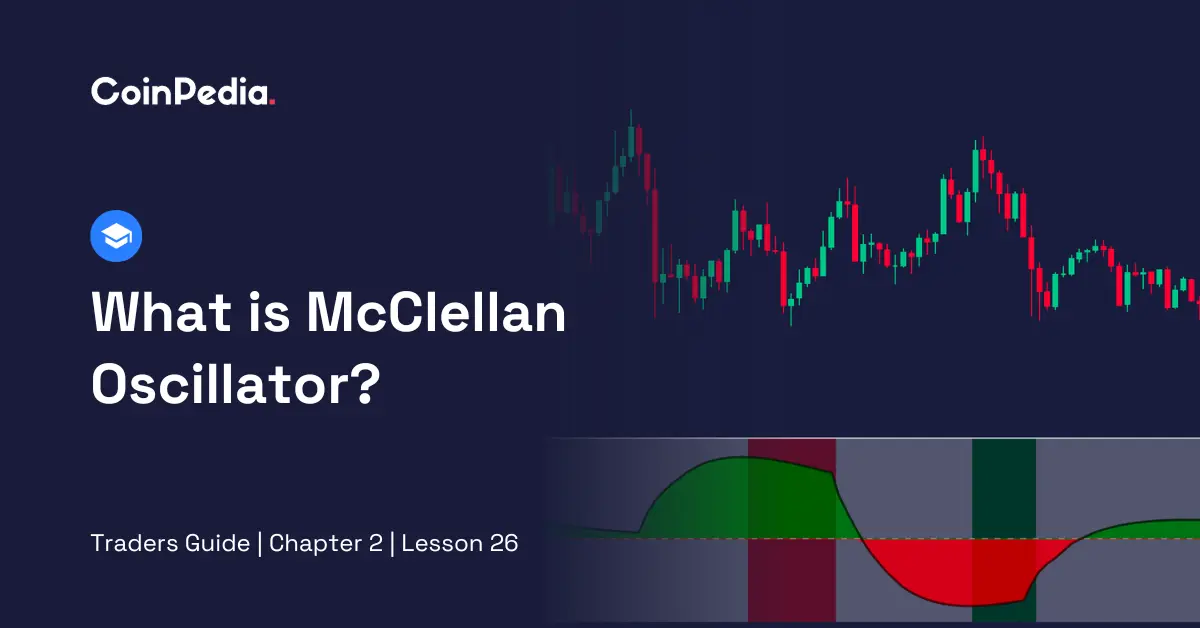
Market breadth indicators are unique as they provide a holistic view of the health and sentiment of the entire crypto market or specific tokens. They help crypto traders and investors confirm trends, assess the overall strength of the market, and identify potential opportunities or risks by analysing a broad spectrum of cryptocurrencies rather than focusing on individual coins. McClellan Oscillator is one of the popular market breadth indicators. Let’s learn about this indicator in depth.
A popular market breadth indicator, McClellan Oscillator, subtracts the number of advancing assets from the number of declining assets. When the oscillator rises above the neutral point, it indicates market strength; when it falls below, it suggests a weaker market.
The McClellan Oscillator indicator was created by Sherman and Marian McClellan in the 1960s to measure market breadth. They wanted a way to see if more stocks were advancing or declining. By subtracting these numbers, they developed an indicator that shows market strength. It helps traders identify buying (above neutral) and selling (below neutral) opportunities based on market sentiment.
The McClellan Oscillator indicator is calculated in four steps.
| McClellan Oscillator = 39-day EMA of (Advancing Issues – Declining Issues) – 19-day EMA of (Advancing Issues – Declining Issues) |
The below is the steps to launch the McClellan Oscillator indicator on a TradingView chart.
Go to the TradingView website and log in to your trading account
After logging in, click on the search option, which is usually located at the top of the TradingView platform.
Select the cryptocurrency you want to analyse and add it to your chart,
Look for the ‘Indicators’ button on the top menu or in the chart settings. Click on it.
In the indicator search bar, type ‘McClellan Oscillator’.
Click on the McClellan Oscillator in the search result, and it will be added to your chart.
You can usually customise the McClellan Oscillator settings, like the period or the type of moving average.
You can now analyse the indicator to make trading decisions.
Also Read: DPO and Crypto: A Winning Combination for Cryptocurrency Traders
The McClellan Oscillator can provide important signals for crypto trading.
When the oscillator is positive, it usually indicates that more cryptocurrencies are advancing than declining. This suggests market strength. It is a good sign for potential buying opportunities.
Conversely, when the oscillator is negative, it means more cryptocurrencies are declining than advancing. This could signal market weakness, and it might be a time to be cautious about buying or consider selling.
Pay attention to the points where the McClellan Oscillator crosses from negative to positive or vice versa. A positive-to-negative crossover can be a signal to be cautious or consider selling, while a negative-to-positive crossover may indicate it is good time to consider buying.
Extremely high positive values or extremely low negative values can suggest overbought or oversold conditions in the market. These extremes might signal potential reversals in the market trend.
The McClellan Oscillator indicator can also provide divergence signals. Divergence occurs when the indicator’s movements don’t align with the price movements of the cryptocurrency you are analysing.
This occurs when the McClellan Oscillator is making higher highs, while the price of the cryptocurrency is making lower lows. It suggests that despite the price falling. There is still underlying strength in the market. Traders might see this as a potential buying opportunity.
This happens when the McClellan Oscillator is making lower highs while the crypto’s price is making higher highs. This can indicate that even though prices are rising, there may be underlying weakness in the market. Traders might consider this a sign to be cautious about buying or think about selling.
The McClellan Oscillator indicator is a powerful tool. It helps measure the strength of the market by tracking the balance between advancing and declining assets. Positive readings indicate market strength, while negative readings suggest caution or selling. Extreme values may indicate overbought or oversold conditions. These insights can aid newcomers in making informed trading decisions. Though it is an indicator known for its high accuracy, it is always better to use this indicator in combination with other indicators.
The crypto market has been bleeding red over the past few weeks, with Bitcoin hovering…
Bitcoin is once again at a critical level, and traders are asking the big question:…
KITE crypto has quietly transitioned from low-volatility consolidation into full-blown on-chain expansion and the data…
Tether's USDT just posted a $1.5 billion supply drop in February, marking the largest monthly…
Ethereum has quietly crossed a major threshold. More than half of its total supply is…
AI agents can now pay for services using XRP and RLUSD on the XRP Ledger,…