You’re watching a stock climb higher and higher. Everyone is excited. The news is full of optimism. Then, suddenly, the price starts to drop. It tries to recover but fails. Before you know it, the price plunges even further. If you knew this would happen, you could have sold at the right time and saved yourself from losses.
This is exactly where the Head and Shoulders pattern comes in. It’s like a warning signal in the market, telling traders that the trend is about to change. If you understand this pattern well, you can avoid getting trapped and even profit from market reversals.
So, let’s break it down in simple terms and make sure you can spot it easily in real-time charts.
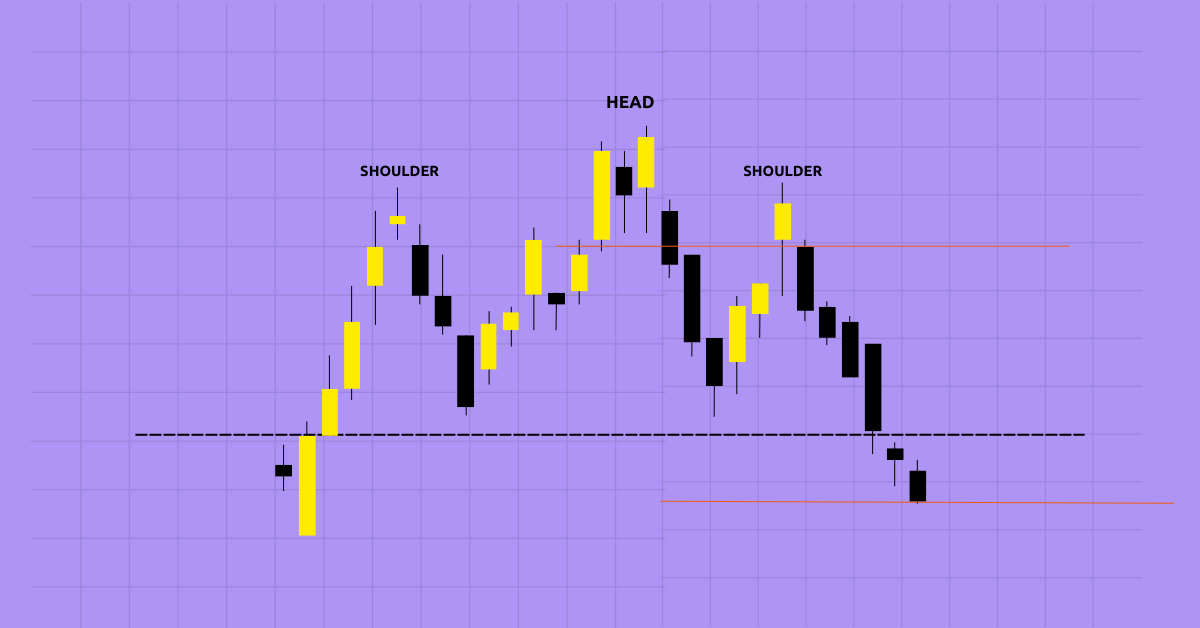
The Head and Shoulders pattern is a chart formation that signals a potential reversal in the market trend. It has three main parts:
It looks like a person’s head and two shoulders when plotted on a chart, which is why it’s named the Head and Shoulders pattern.
There are two types:
Let’s dive into both.
Let’s say a stock was rising steadily and peaked at $200 (Head). Before that, it made a high at $190 (Left Shoulder) and after the peak, it tried again but only reached $195 (Right Shoulder). Once it broke below $180 (Neckline), it signaled that the bullish trend was over, and the stock dropped further.
Bitcoin was falling from $50,000 and made a low at $40,000 (Left Shoulder). It tried to recover but fell again to $35,000 (Head). Then, it bounced back, dropped slightly to $38,000 (Right Shoulder), and then shot up past $42,000 (Neckline), confirming a bullish reversal.
Example:
High volume on breakout means strong confirmation.
The Head and Shoulders pattern is one of the most reliable reversal indicators in trading. It helps you exit early before a downtrend or enter early before an uptrend.
To recap:
Next time you see this pattern forming on a chart, you’ll know exactly what to do!
Now, go ahead and start spotting these patterns in live markets. The more you practice, the sharper your trading skills will become.
The Head and Shoulders pattern is a chart formation that signals a trend reversal, either bearish (regular) or bullish (inverse).
Look for three peaks: a higher middle peak (head) between two lower peaks (shoulders), with a neckline acting as support or resistance.
Traders enter positions after a neckline breakout, using stop-losses near the right shoulder and targeting a price equal to the head-to-neckline distance.
Yes, it’s one of the most trusted reversal patterns, but confirmation with volume and other indicators is essential to avoid false breakouts.
CoinPedia has been delivering accurate and timely cryptocurrency and blockchain updates since 2017. All content is created by our expert panel of analysts and journalists, following strict Editorial Guidelines based on E-E-A-T (Experience, Expertise, Authoritativeness, Trustworthiness). Every article is fact-checked against reputable sources to ensure accuracy, transparency, and reliability. Our review policy guarantees unbiased evaluations when recommending exchanges, platforms, or tools. We strive to provide timely updates about everything crypto & blockchain, right from startups to industry majors.
All opinions and insights shared represent the author's own views on current market conditions. Please do your own research before making investment decisions. Neither the writer nor the publication assumes responsibility for your financial choices.
Sponsored content and affiliate links may appear on our site. Advertisements are marked clearly, and our editorial content remains entirely independent from our ad partners.
Crypto in the last 24 hours just got a jolt that changes everything. Japan's cabinet…
Justin Sun says World Liberty Financial secretly built a backdoor into its smart contract that…
A post from pioneer Daniel F is generating discussion in the Pi community, and the…
The events unfolding in the Strait of Hormuz are not just a geopolitical story. According…
Crypto markets slipped on Friday after Vice President JD Vance confirmed that direct US-Iran negotiations…
Right now, Chainlink price is hovering in a well-defined range, with support sitting around $8…

