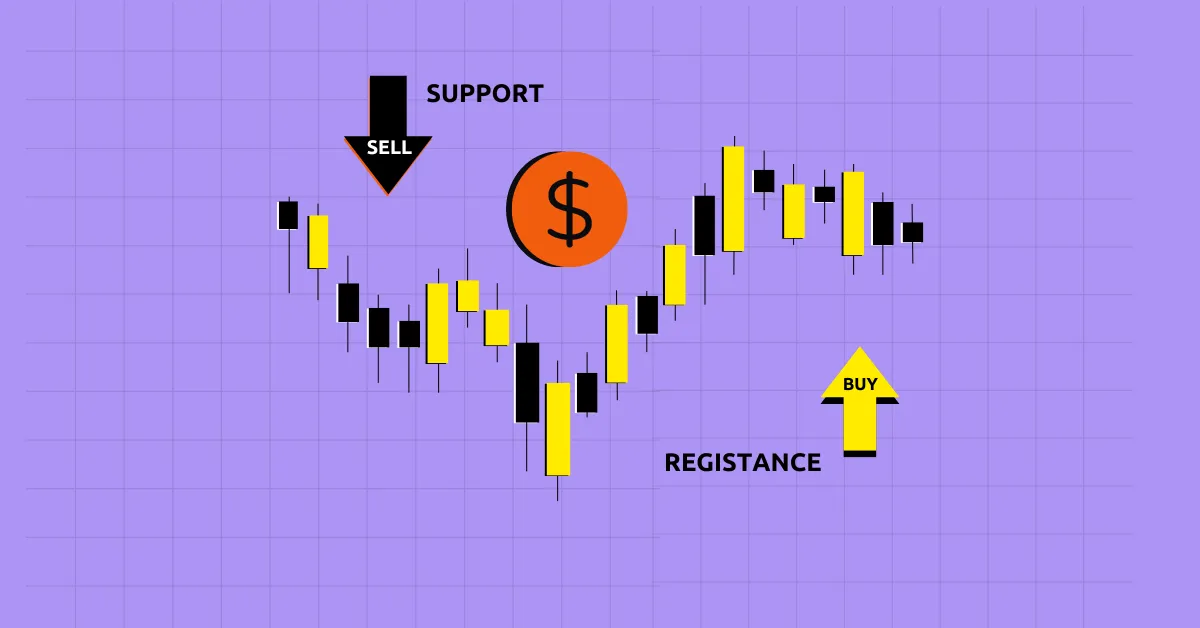
If you’ve ever watched a price chart, you’ve probably noticed something strange. Prices go up, then suddenly stop and drop. Or they fall, hit a certain level, and then bounce back up. It almost looks like magic. But it’s not. It’s all about support and resistance levels.
These levels are some of the most important concepts in trading. If you get them right, you can predict where prices might stop and reverse. That gives you an edge. So, let’s break it all down in simple terms.
Think of support as a safety net. Imagine a stock price is falling like a ball. It keeps dropping until it hits a strong floor. That floor is supported. It’s a level where buyers step in and push the price back up.
Support happens because traders remember past price levels. If Bitcoin fell to $40,000 last time and bounced back, traders will expect it to do the same again. So when the price nears $40,000, buyers rush in, creating demand.
Let’s say you’re looking at Apple’s stock. Every time it drops to $150, it bounces back. That means $150 is acting as a strong support level. Traders watching the chart see this and start buying near that level.
The more times a price bounces from the same level, the stronger that support becomes.
Resistance is the opposite of support. It’s like a ceiling that stops the price from going higher. Think of a ball being thrown up in the air. It goes up but hits the ceiling and falls back down. That ceiling is resistance.
Resistance happens because traders see past price levels where selling increased. If Ethereum struggled to go above $3,500 before, traders will expect it to struggle again. So, when the price gets close to that level, sellers rush in.
Imagine Tesla stock keeps hitting $1,000 but never goes higher. Each time it reaches $1,000, sellers appear, pushing it back down. That means $1,000 is acting as a strong resistance level.
The more times a price gets rejected at a level, the stronger the resistance becomes.
You don’t need fancy indicators to find these levels. Here’s how you do it:
Support and resistance work because of human psychology. Traders remember key price levels. They react based on fear and greed.
Now, let’s talk about using this in your trades. Here are some strategies:
Support and resistance exist on all timeframes.
A level that is strong on a daily chart is more reliable than one on a 5-minute chart.
Support and resistance are the building blocks of technical analysis. They help traders understand where prices might stop and reverse.
If you learn how to use these levels correctly, you’ll improve your trading decisions. So next time you look at a chart, try spotting these key levels. You might just predict the next big move!
Also read: Trade with Confidence: Flags and Pennants in Crypto Explained
Yes! When a support level is broken, it often turns into resistance. Likewise, when resistance is broken, it can turn into support.
Moving averages, like the 50-day or 200-day moving average, often act as dynamic support and resistance levels.
When a price breaks through support or resistance with strong volume, it often signals the start of a new trend in that direction.
No. Different assets have different levels based on their price history, market participants, and overall trends.
Yes! Many traders use Fibonacci levels to identify potential support and resistance zones in the market.
CoinPedia has been delivering accurate and timely cryptocurrency and blockchain updates since 2017. All content is created by our expert panel of analysts and journalists, following strict Editorial Guidelines based on E-E-A-T (Experience, Expertise, Authoritativeness, Trustworthiness). Every article is fact-checked against reputable sources to ensure accuracy, transparency, and reliability. Our review policy guarantees unbiased evaluations when recommending exchanges, platforms, or tools. We strive to provide timely updates about everything crypto & blockchain, right from startups to industry majors.
All opinions and insights shared represent the author's own views on current market conditions. Please do your own research before making investment decisions. Neither the writer nor the publication assumes responsibility for your financial choices.
Sponsored content and affiliate links may appear on our site. Advertisements are marked clearly, and our editorial content remains entirely independent from our ad partners.
Bitcoin’s bounce from below $60,000 was sharp enough to shift sentiment in the short term,…
Goldman Sachs has revealed significant investments in digital assets, holding around $1.1 billion in Bitcoin,…
Story Highlights The live price of the LINK token is . Price prediction for 2026…
Bitcoin (BTC) price has rebounded towards $70,000 on Tuesday, February 10, during the North American…
A growing online debate about whether Bitcoin had the “fairest launch in history” has taken…
Fresh claims circulating in the crypto market suggest that alleged leaked documents and institutional reports…