The first thing a new cryptocurrency trader should understand is that they should never let their emotions affect their trading decisions. Traders often forget this when assessing the strength of a trend. If a trader relies on non-emotional factors, like indicators, they can avoid making mistakes. This is where the importance of indicators like Aroon Oscillator, which can accurately measure the strength of a trend, becomes relevant. Let’s explore this interesting indicator in more detail.
The Aroon indicator, created by Tushar Chande in 1995, assesses a trend’s strength by considering how long an asset’s price stays above or below a specific level.
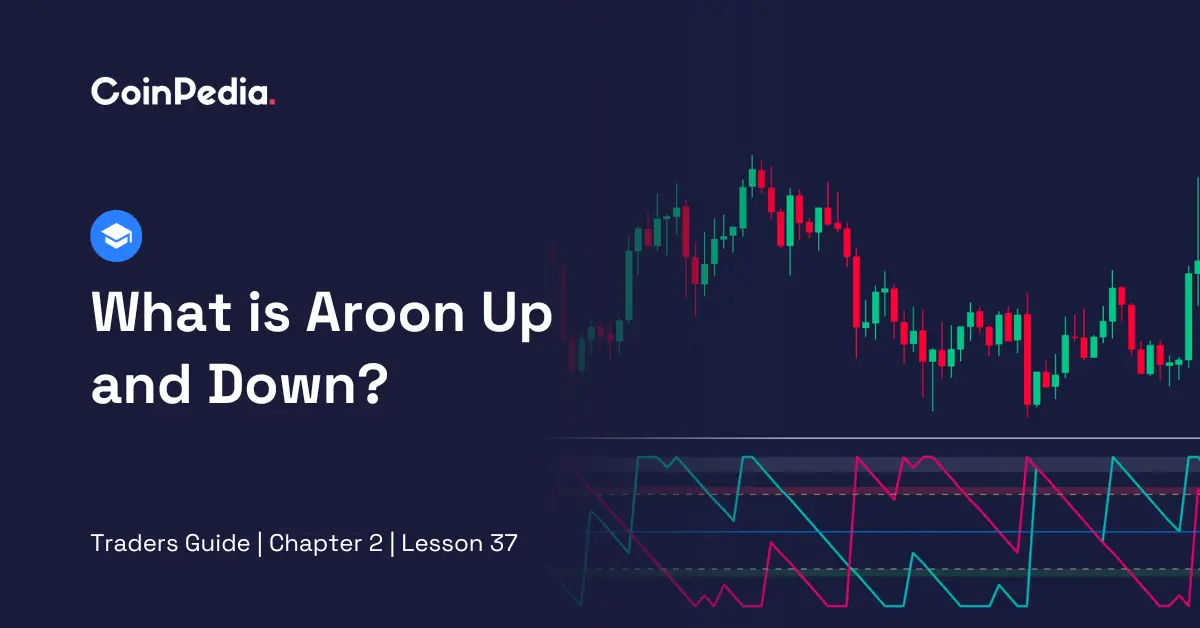
The Aroon Oscillator measures if a financial trend is going up or down. It is typically represented as a single line, known as the Aroon Oscillator line, which moves above and below a central zero line. To derive this line, it considers two factors: Aroon Up (how strong the uptrend is) and Aroon Down (how strong the downtrend is). By subtracting Aroon Down from Aroon Up, you get the Oscillator line.
Calculating Aroon Oscillator requires these three simple formulas:
| Aroon Up = [(Number of periods – Number of periods since the highest high) / Number of periods] * 100 |
| Aroon Down = [(Number of periods – Number of periods since the lowest low) / Number of periods] * 100 |
They measure the time an asset’s price reaches the highest and lowest points over a certain period.
Once they are calculated, time to proceed to the final step.
| Aroon Oscillator = (Aroon Up – Aroon Down) * 100 |
The Aroon Oscillator is calculated by taking the difference between Aroon Up and Aroon Down, and then multiplying that difference by 100.
Here are the simple steps to launch the Aroon Oscillator on a TradingView chart:
Log in to your TradingView account.
Find a specific chart or select a random one you want to analyse.
Click on the chart to open it
At the top of the chart, you will see a toolbar. Click on the ‘Indicator’ tab.
In the search bar, type ‘Aroon Oscillator’ to locate the indicator.
Click on the Aroon indicator from the search results, and then click the ‘Add to Chart’ button.
You can adjust the settings of the Aroon Oscillator, like the number of periods, to fit your analysis by clicking on the settings icon.
Once configured, you will see the Aroon Oscillator line on your chart. Analyse the Aroon line to assess the strength of trends.
The Aroon Oscillator indicator is commonly used to measure the strength of a trend.
If the Aroon Oscillator is positive, it signals a strong upward trend. If it is negative, it suggests a strong downward trend.
The bigger the number (positive or negative), the stronger the trend.
If the Aroon Oscillator is moving in the opposite direction to the price trend, it might signal a potential reversal.
Also read: Time Segmented Volume: A Must-Have Tool for Crypto Trading Beginners
The Aroon Oscillator is a valuable tool for assessing trends in trading. It helps traders understand whether an uptrend or downtrend is emerging and how strong it is. By following the steps to launch the Aroon Oscillator on TradingView, traders can gain insights into market movements and make informed decisions. Remember that understanding how to read the Aroon Oscillator line is essential for successful trend analysis, ultimately helping traders navigate the complex world of financial markets more effectively.
CoinPedia has been delivering accurate and timely cryptocurrency and blockchain updates since 2017. All content is created by our expert panel of analysts and journalists, following strict Editorial Guidelines based on E-E-A-T (Experience, Expertise, Authoritativeness, Trustworthiness). Every article is fact-checked against reputable sources to ensure accuracy, transparency, and reliability. Our review policy guarantees unbiased evaluations when recommending exchanges, platforms, or tools. We strive to provide timely updates about everything crypto & blockchain, right from startups to industry majors.
All opinions and insights shared represent the author's own views on current market conditions. Please do your own research before making investment decisions. Neither the writer nor the publication assumes responsibility for your financial choices.
Sponsored content and affiliate links may appear on our site. Advertisements are marked clearly, and our editorial content remains entirely independent from our ad partners.
Crypto is moving into regulated portfolios, including U.S. retirement plans. That shift matters less for…
In another blow to the decentralized finance giant, Chaos Labs has announced it will step…
Story Highlights The live price of the ARB token is . Price predictions for 2026…
TAO price showed a sharp 10% intraday surge pushed it cleanly off a key level…
XRP price has been stuck within a strong descending trend for the past 8 months,…
Bitcoin investors hoping for a quick recovery may need to be patient. That is the…