You are already aware that finding a good combination of trading indicators can lead to an excellent trading strategy. Some indicators save us the trouble of searching for new combinations since they are already perfect combinations of different efficient indicators. There is always an advantage in mastering such indicators. If you are interested in learning about one such indicator, you should explore the Elder Impulse System Indicator, known as the ‘indicator or indicators.’ Let’s dive into it.
The Elder Impulse System is a powerful technical analysis tool used in crypto trading by professional cryptocurrency traders. It combines two different indicators. Crypto traders use it to help figure out the best times to buy and sell cryptos and also to recognise when a trend in the market might change direction.
The Elder Impulse System was created by a well known trader and author named Alexander Elder. He combined two important indicators into one system. These indicators are the Moving Averages and the MACD (Moving Average Convergence and Divergence).
The Elder Impulse System combines two indicators: a 13-day Exponential Moving Average and a MACD-Histogram. Each of these indicators has a specific job. The EMA helps us see the trend in the market, like whether prices are generally going up or down. On the other hand, the MACD-Histogram helps us figure out how fast prices are changing, or the momentum. If the EMA is going up, it suggests an uptrend, and if the MACD-Histogram is positive, it shows strong momentum.
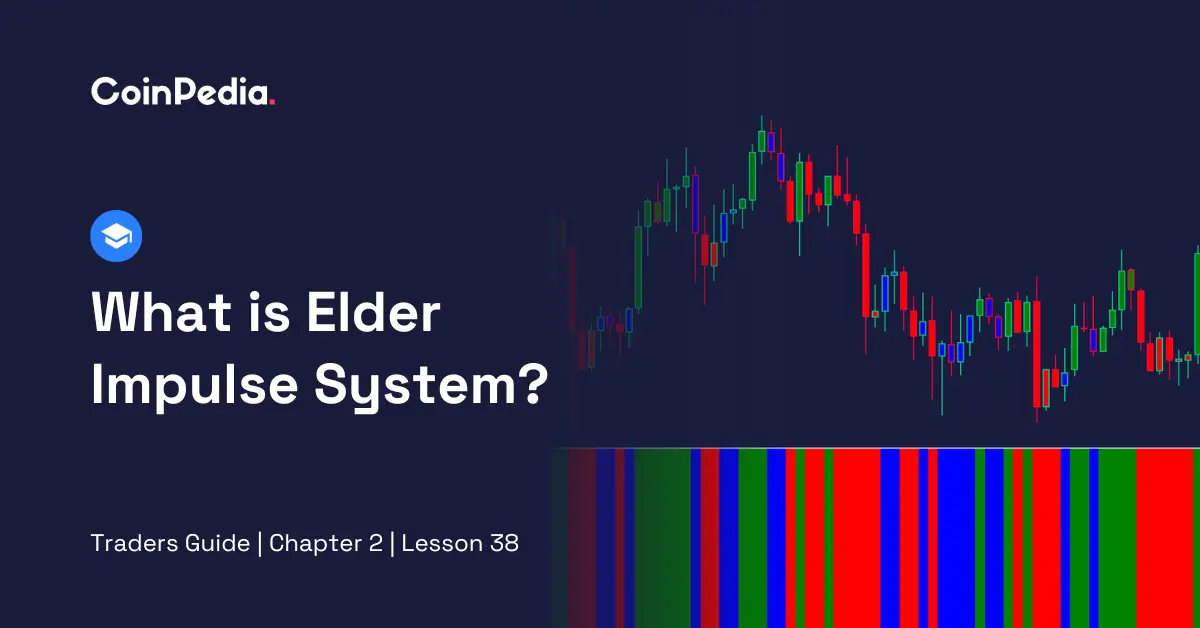
The Elder Impulse System Indicator is shown using candlesticks that come in three colours: Green, Red and Blue. Green Candles represent periods of bullish market. Red Candles correspond to periods of bearish market. And, Blue Candles indicate mixed indications.
Let’s break down the calculation of the Elder Impulse System.
| Green = (13-period EMA > pervious 13-period EMA) and (MACD-Histogram > previous period’s MACD-Histogram) |
A green price bar occurs when the currency 13-period EMA is higher than the previous 13-period EMA, and the current MACD-Histogram is greater than the previous MACD-Histogram.
| Red = (13-period EMA < previous 13-period EMA) and (MACD-Histogram < previous period’s MACD Histogram) |
A red price bar happens when the current 13-period EMA is lower than the previous 13-period EMA, and the current MACD-Histogram is less than the previous MACD-Histogram.
If the conditions for a green or red price bar are not satisfied, the price is coloured blue.
Notably, the MACD-Histogram used in the system is based on the MACD (12, 26, 9).
Here are the steps to launch the Elder Impulse System on a TradingView chart:
Here is the simplest way to interpret Elder Impulse System:
When we see a green bar, interpret that the market is in an upward trend with strong momentum.
When we see a red bar, assume that the market is in a downward trend with weak momentum.
When we see a blue bar, interpet that there is no clear signal for a strong upward or downward trend.
Also Read: Gann Fan Decoded: Navigating Cryptocurrency Trends with Precision
In conclusion, the Elder Impulse System is a valuable tool for cryptocurrency traders, helping them make informed decisions in the dynamic crypto market. Developed by Alexander Elder, it combines Moving Averages and MACD indicators. We have discussed its origin, functionality, appearance, calculation, implementation on TradingView, and interpretation of its signals. By understanding the Elder Impulse System, traders can navigate crypto trading with more confidence.
CoinPedia has been delivering accurate and timely cryptocurrency and blockchain updates since 2017. All content is created by our expert panel of analysts and journalists, following strict Editorial Guidelines based on E-E-A-T (Experience, Expertise, Authoritativeness, Trustworthiness). Every article is fact-checked against reputable sources to ensure accuracy, transparency, and reliability. Our review policy guarantees unbiased evaluations when recommending exchanges, platforms, or tools. We strive to provide timely updates about everything crypto & blockchain, right from startups to industry majors.
All opinions and insights shared represent the author's own views on current market conditions. Please do your own research before making investment decisions. Neither the writer nor the publication assumes responsibility for your financial choices.
Sponsored content and affiliate links may appear on our site. Advertisements are marked clearly, and our editorial content remains entirely independent from our ad partners.
XRP price currently stands at $2.99, with a market capitalization of $179.79 billion. Analysts and…
Story Highlights The live price of the Avalanche is . Price predictions for 2026 range…
Bitcoin has once again tested investor conviction. After revisiting levels last seen during the 2025…
On February 6, the crypto market saw a sharp crash as Bitcoin plunged nearly 15%,…
Recently, the shift toward a "risk-off" sentiment is largely driven by a more hawkish U.S.…
The price of XRP continued to move lower this week, extending its corrective phase after…