- Steve Muchoki
 Steve Muchoki
- Jul 28, 2025 19:03 UTC
-
Solana Price Analysis: SOL Enters Make or Break Sell Wall
On-chain data shows a renewed demand for Solana amid the anticipated altseason.
The Solana network remains heavily reliant on memecoins for mainstream adoption.
SOL price must hold above $170 to sustain a rally above $200 in the near term.
Solana (SOL) price has entered a crucial sell wall between $170 and $203, which has resulted in multi-weeks of choppy markets since March 2024. The large-cap altcoin, with a fully diluted valuation of over $112 billion, has attempted to regain bullish momentum to mirror Ethereum (ETH) and Binance Coin (BNB).
Furthermore, the wider altcoin market has signaled bullish sentiment following the recent Bitcoin dominance drop from 66 percent to 61 percent. Additionally, the Altcoin Season Index from coinglass shows the odds of an altseason have significantly increased fueled by clear crypto regulatory frameworks and renewed demand from institutional investors.
What the On-chain Data Analysis Signals for Solana Price
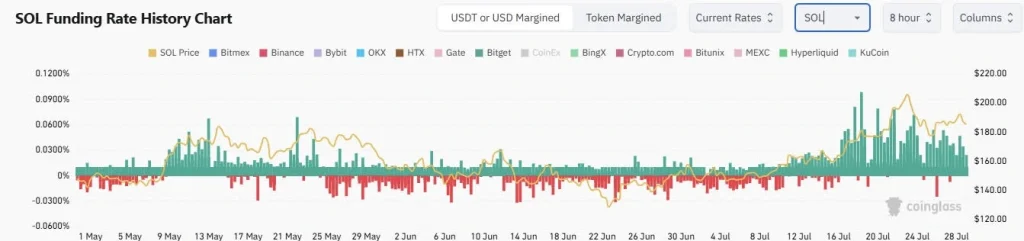
According to market data analysis from coinglass, Solana’s funding rate has remained positive for the past month. Historically, a sustained positive funding rate often signals a macro bullish outlook and vice versa.
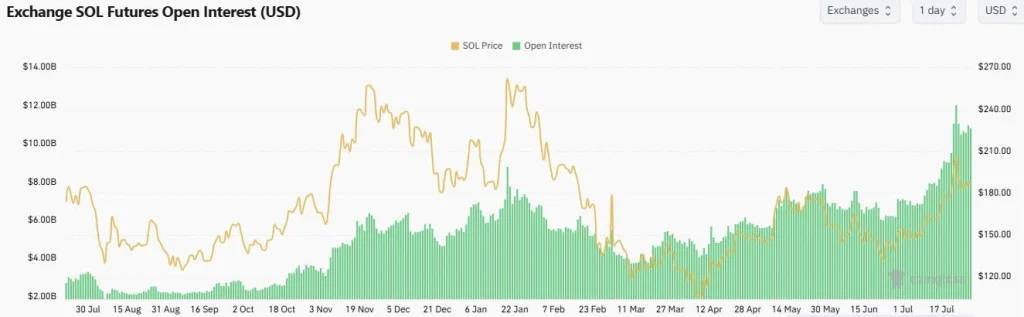
Additionally, Solana’s Futures Open Interest (OI) has slithered to an all-time high of above $10 billion. The rising OI suggests an increase in speculative trading, amid the wider bull market.
Closer Look at SOL Chart
Solana price in the weekly timeframe has entered a pivotal range, which could either lead to a parabolic rally or choppy markets in the midterm. Notably, the SOL price has formed a potential macro head and shoulders pattern (H&S) coupled with a bearish divergence of the weekly Relative Strength Index (RSI).
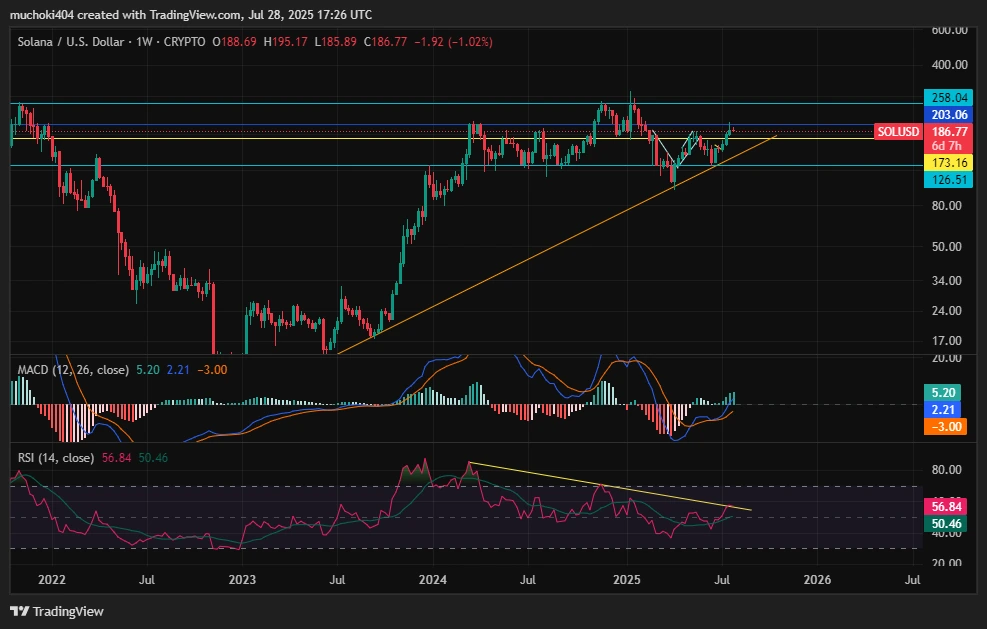
However, the weekly MACD indicator has signaled bullish sentiment in the near term. Moreover, the MACD and signal lines recently crossed above the zero line amid growing bullish histograms.
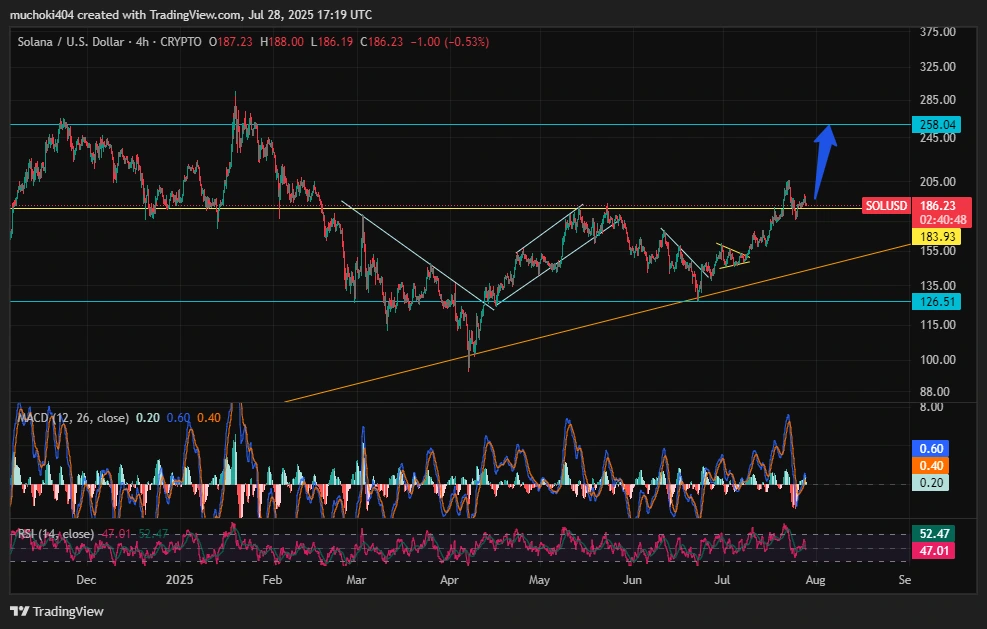
In the four-hour time frame, the SOL price must hold above the support level of $170 to rally above $200 towards the midterm target of $254.
Renewed Demand From Institutional Investors Signals Bullish Sentiment
The Solana network has enjoyed a renewed demand from institutional investors seeking to diversify from Bitcoin and Ethereum. For example, Upexi, a company focused on Solana treasury, entered into a $500 million line of credit agreement to fund additional SOL token purchases.
Meanwhile, on-chain data shows whale investors have been aggressively accumulating SOL from the various cryptocurrency exchanges.